

The Explorer is currently in Beta. The set of supported chart types, dimensions, and data sources is still expanding.
Choosing an Explorer
Open Product Analytics in the left sidebar. From the landing page, you can:- Ask a question with AI Chat — Type a question like “How many signups did we have last week, broken out by country?” and let GrowthBook generate the exploration for you.
- Choose an explorer manually — Pick the type that matches the shape of your data:
Each explorer opens with the same layout: a chart on the left, a configuration sidebar on the right, and a toolbar above the chart for chart type, date range, and granularity.
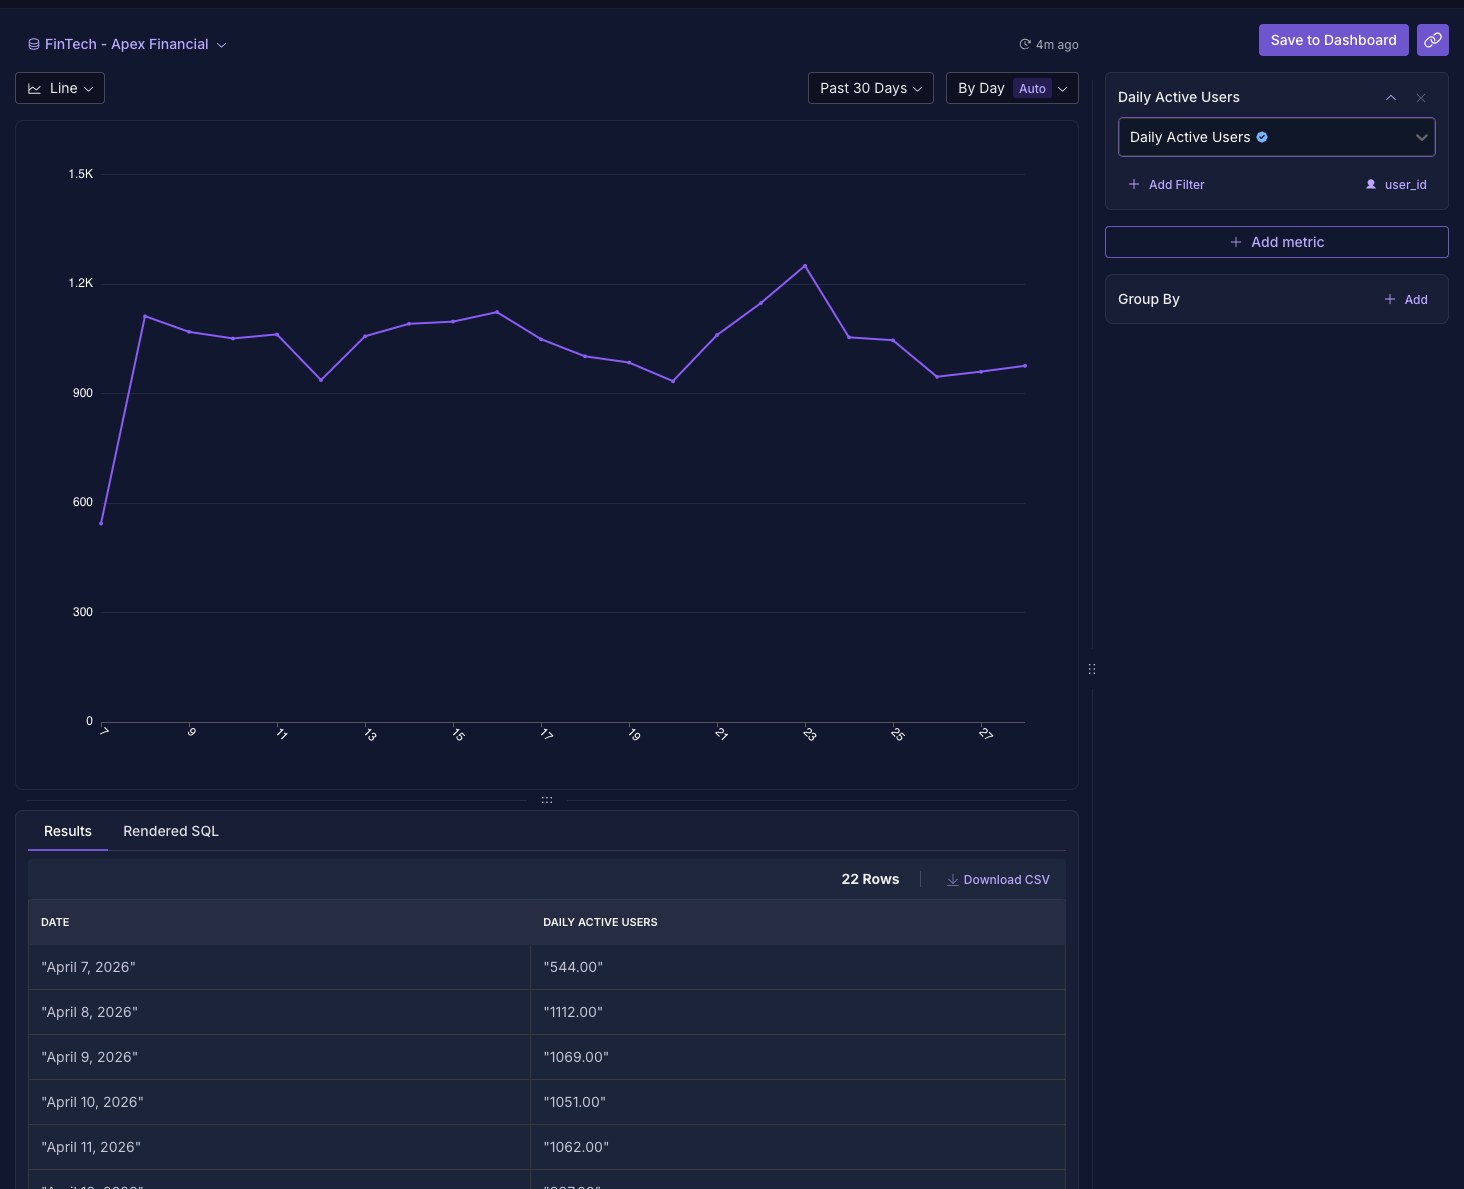
Configuring an Exploration
The sidebar controls everything that goes into the chart. Whenever you change a setting, the chart goes “stale” — an amber dot appears next to the Update button. Click Update to re-run the query with the new configuration.Data Source
Pick the data source you want to query from the dropdown at the top of the chart area. The dropdown is filtered to data sources you have permission to query in the current project. If you change the data source mid-exploration and you’ve already configured values, GrowthBook prompts for confirmation since switching clears your current dataset. The Fact Table and Data Source explorers only show tables that belong to the selected data source.Values
Values are the things being measured. The available value types depend on which explorer you’re in.Metric Explorer
Add one or more existing fact metrics. Metrics are grouped in the dropdown:- Official Metrics — metrics managed by GrowthBook or imported from a managed source.
- Other — metrics created and edited directly in your organization.
- Ratio metrics can’t be combined with non-ratio metrics in the same chart.
- Quantile metrics can’t be combined with other metric types.
- All other metric types can be mixed freely.
Fact Table Explorer
Pick a fact table from the dropdown, then add one or more values. Each value has:- Value type —
Unit Count(distinct users),Count(rows), orSumof a numeric column. - Value column (when value type is
Sum) — choose which numeric column to sum. Onlynumber-typed columns from the fact table are listed.
Data Source Explorer
Pick a table from your warehouse, then choose its Timestamp Column — GrowthBook will try to infer this from the column types, but you can override it. After that, the value configuration is the same as the Fact Table explorer (Unit Count, Count, or Sum).
If you haven’t built an information schema for the data source yet, the explorer prompts you to generate one. Schema building runs in the background; if it takes more than a few minutes, you’re free to leave the page and come back later.
Row Filters
Each value in the Fact Table and Data Source explorers can have its own row filters to narrow which events contribute to it.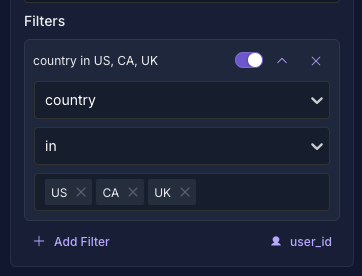
- Column — a column on the fact table or data source. JSON sub-fields appear as
column.field. You can also pickSQL Expressionto write a raw SQLWHEREclause, orSaved Filter(Fact Tables only) to reuse a filter defined on the fact table. - Operator — depends on the column’s data type. Common operators include
=,!=,in,not_in,is_null,not_null,>,<,>=,<=,contains, andlike. Boolean columns getis_true/is_false. - Value — for
in/not_inoperators, you can enter multiple values; for=/!=, GrowthBook will surface the column’s top values in a dropdown so you don’t have to type them. Operators likeis_null,not_null,is_true, andis_falsedon’t take a value.
country in US, CA so you can scan the list at a glance.
Date Range
Choose how far back the query should look:- Today — events from midnight today.
- Past 7 / 30 / 90 Days — rolling windows ending now.
- Custom Lookback — look back N hours, days, weeks, or months from now (e.g., “last 14 days”).
- Custom Date Range — pick explicit start and end dates.
Group By
Add one or more dimensions to break the chart down. The Explorer supports four dimension types:- Date — Bucket by hour, day, week, month, or year. The date dimension is added automatically for time-series chart types.
- Dynamic — Pick a column and let GrowthBook surface the top N values automatically. Max values defaults to 5 and can be set between 1 and 20 in the dimension’s Advanced Options. Other rows are grouped into “Other”.
- Static — Pick a column and specify the exact values you want to compare. Anything outside the list is excluded.
- Slices — Define named groups using row filters (for example, “New Users” vs. “Returning Users”). Each slice gets its own series on the chart.
Show As
For metrics that have a denominator (such as ratio or proportion metrics), the Show As section appears under Group By and lets you choose how the value is rendered:- Event Totals — Render the raw numerator (e.g., total purchases).
- Per Unit — Divide numerator by denominator (e.g., purchases per active user). The label changes to match the unit (e.g., “Per anonymous_id”).
Chart Type
Switch between visualizations from the toolbar. The selector is grouped by chart family:
A few rules apply automatically:
- The Granularity selector only appears for time-series charts.
- Big Number doesn’t accept multiple values, dimensions, or group-by columns.
- The chart type drives which dimensions are useful — for example, stacked bar charts need at least one group-by dimension to be meaningful.
Granularity
For time-series charts, Granularity controls how dates are bucketed:Auto, By Hour, By Day, By Week, By Month, By Year. Auto picks a sensible bucket based on the date range (e.g., a 7-day window auto-selects By Day, a 1-year window auto-selects By Week).
Granularities that would produce too many or too few buckets for the selected date range are hidden from the dropdown.
Funnels
The Funnel explorer measures how many users complete a sequence of steps and where they drop off. Use it to answer questions like “of the users who viewed a product, how many added it to a cart, and then checked out?” Pick Funnel from the explorer list. A funnel uses the same chart-and-sidebar layout as the other explorers, but instead of a list of values you configure an ordered list of steps.Steps
A funnel is an ordered list of steps, and it needs at least two. Click Add step to append one. Each step has:- Name — Double-click the step header to rename it. Defaults to
Step N. - Fact table — Where the step’s events come from. The first step sets the funnel’s fact table; each later step inherits from the previous step and can Override fact table to point somewhere else. This lets one funnel span multiple fact tables, for example a
viewstable for step 1 and anorderstable for step 2. - Row filters — Applied per step to define what counts as completing it, such as
event_name = add_to_cart. These work exactly like Row Filters elsewhere in the Explorer.
User identifier
A funnel counts unique units that move through the steps in order, matched by a single identifier that exists on every step’s fact table. If the steps don’t share an identifier type, GrowthBook shows “No shared user identifier across steps” and the funnel won’t run until the steps have one in common.Optional steps and conversion windows
Steps after the first have an Advanced Options section:- Optional step — Users who skip this step can still convert to later steps. Use it for steps that aren’t required to continue.
- Conversion window — How long after the previous step a user has to complete this step and still count. Enter a number and a unit:
minutes,hours,days, orweeks. With no conversion window, a step counts as long as it happens after the previous one.
Breaking down a funnel
Add a dimension in the Group By section to split the funnel by a property, such as country or plan. Funnels use a single, first-touch dimension: each unit is bucketed by the dimension value on its first step.Reading the results
Switch between two views from the toolbar:- Funnel — One bar per step, with the drop-off to the next step shown behind it.
- Funnel Table — The same data in tabular form.
- Unit Count — The number of units that reached the step.
- Percent — The share of the starting cohort that reached the step.
Supported data sources
Funnels run on Postgres, ClickHouse (including the Managed Warehouse), BigQuery, Snowflake, Athena, Presto, Databricks, and Redshift.Vertica, MySQL, and MSSQL are not yet supported for funnels. The Funnel explorer is hidden for data sources it can’t query.
Saving and sharing
Like any other exploration, a funnel can be saved to a dashboard or shared as a link.Running and Refreshing
When the configuration is valid, click Update to run the query. A clock icon next to the toolbar shows when the chart was last refreshed (e.g., “5m ago”). Click it to open a dropdown with a Refresh option to manually re-run the query, even if the configuration hasn’t changed. GrowthBook caches exploration results: re-opening the same exploration with the same configuration uses the cached result rather than re-querying the warehouse. Forcing a refresh ignores the cache and runs a fresh query.Saving and Sharing
Once an exploration looks the way you want it, you have a few options:Save to Dashboard
Click Save to Dashboard to add the exploration as a block on a Product Analytics Dashboard. You’ll be asked for:- Chart Title — required.
- Save to — pick an existing dashboard or create a new one. The existing dashboard list is filtered to dashboards you have permission to edit.
- (When creating new) Name, Projects, and Advanced Settings — the same view/edit access, auto-update, and schedule controls available when creating a dashboard from scratch.
Share a Link
The link icon next to Save to Dashboard copies a URL that encodes the full exploration configuration. Anyone in your organization with read access to the underlying data source can open it.AI Chat
The AI Chat panel at/product-analytics/explore/ai-chat lets you ask questions about your metrics and data in natural language. It uses the same building blocks as the manual explorers, so any chart it produces can be tweaked, saved to a dashboard, or shared.
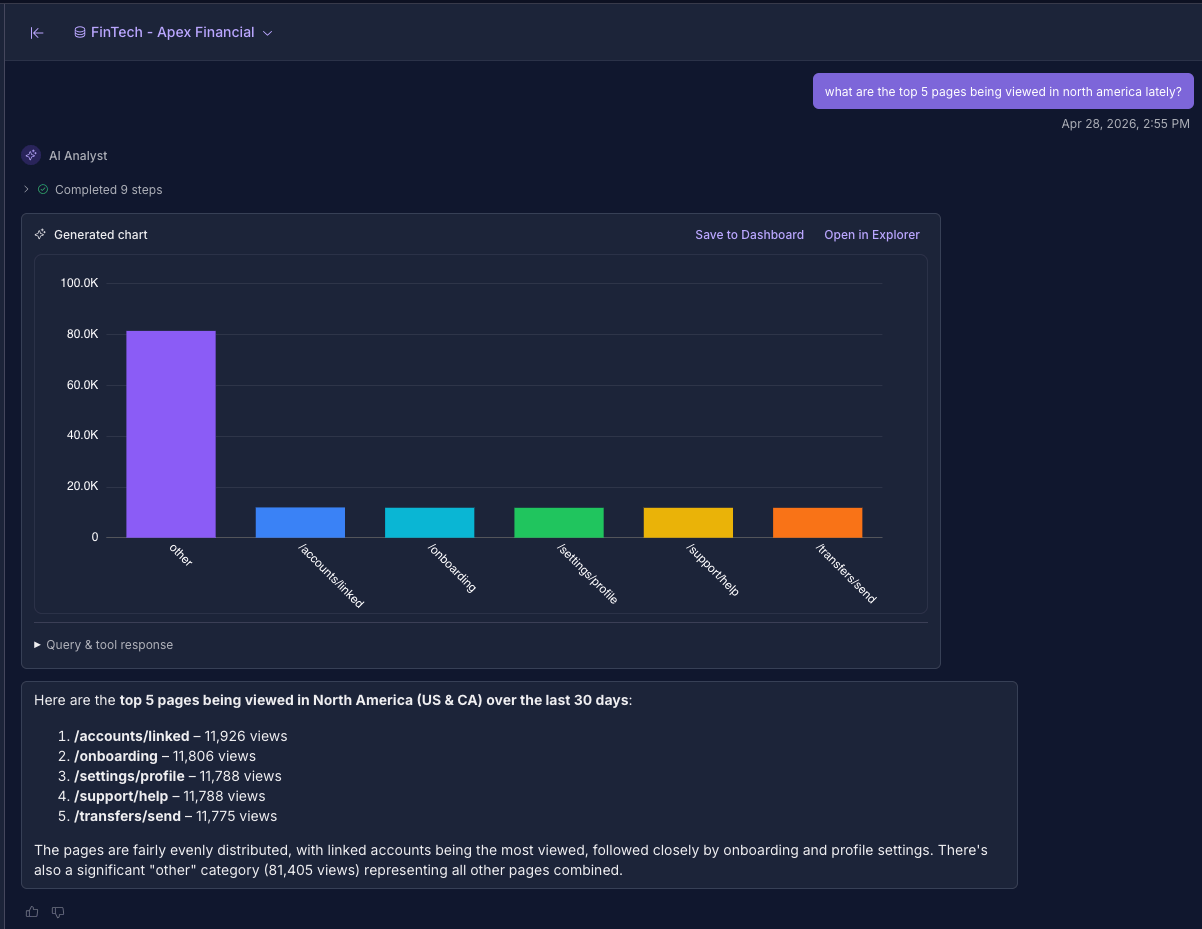
What it can do
The AI agent has access to a small set of tools and will narrate what it’s doing as it works:- Search the data sources, fact tables, and metrics available to you.
- Inspect data shape — list available columns and column types on a table.
- Inspect values — sample top values for a column.
- Run an exploration — produce a chart inline in the conversation. You can click into any chart to open it in the Explorer for further editing.
- Get a snapshot — pull recent values when reasoning about your data.
Conversations and history
Conversations are persisted, so you can come back later and pick up where you left off. The sidebar lists previous conversations and lets you start a new chat at any time. While the agent is generating a response, you can cancel mid-stream. You can also choose which model to use from the dropdown — GrowthBook defaults to the model configured in Settings → General → AI.Requirements
AI Chat requires both:- AI features enabled for your organization (configured under Settings → General → AI).
- The AI Suggestions commercial feature on your plan.
Custom SQL Reports
For analysis that doesn’t fit the structured explorers, use Custom SQL Reports at/sql-explorer. The page lists all saved queries in your organization, scoped to the current project.
Writing a query
Clicking New SQL Report opens the SQL Explorer modal. You get:- A schema browser showing databases, schemas, tables, and columns for the selected data source.
- A SQL editor with auto-complete on table and column names, and a “Format SQL” button (when supported by the dialect).
- A results panel that shows the first 1,000 rows along with the rendered SQL and query duration. Results can be downloaded as CSV.
- Optional AI assistance for generating or modifying SQL (requires the AI Suggestions commercial feature).
SQL Explorer enforces read-only
SELECT queries. The query is rejected client-side if it doesn’t start with SELECT or WITH (after stripping comments and string literals). Results are capped at 1,000 rows.Visualizations
Once a query has run successfully, switch to a visualization tab to render the results as a chart. Saved queries can have any number of visualizations attached. Available chart types are:- Bar
- Line (with an option to anchor the y-axis to zero)
- Area
- Scatter
- Big Value — a single number with formatting options (
shortNumber,longNumber,currency,percentage,accounting). - Pivot Table
Saving and reusing
Saving a query requires the Save SQL Explorer Queries commercial feature, available on Pro and Enterprise plans. Saved queries can be:- Re-opened from the Custom SQL Reports list.
- Linked to dashboards via the Custom SQL Query block type. A single saved query can power multiple dashboards.
Permissions
The actions available in the Explorer depend on your role and project assignments:
See User Permissions for a full breakdown of what each role can do.