> ## Documentation Index
> Fetch the complete documentation index at: https://docs2.growthbook.io/llms.txt
> Use this file to discover all available pages before exploring further.
# Experimenting
# Experimenting in GrowthBook
The Experiments section in GrowthBook is all about analyzing raw experiment results in a data source.
Before analyzing results, you need to actually run the experiment. This can be done in several ways:
* Feature Flags (most common)
* Running an inline experiment directly with our SDKs
* Our [Visual Editor](/app/visual)
* Your own custom variation assignment / bucketing system
When you go to add an experiment in GrowthBook, it will first look in your data source for any new
experiment ids and prompt you to import them. If none are found, you can enter the experiment
settings yourself.
## Experiment Splits
When you run an experiment, you need to choose who will get the experiment, and what percentage
those users should get each variation. In GrowthBook, we allow you to pick overall exposure
percentage, as well as customize the split per variation. Yor can also target an experiment at just some
attribute values.
GrowthBook uses deterministic hashing to do the assignment. That means that each user’s hashing
attribute (usually user id), and the experiment name, are hashed together to get a number from 0 to 1.
This number will always be the same for the same set of inputs.
There is quite often a need to de-risk a new A/B test by running the control at a higher percentage of
users than the new variation, for example, 80% of users get the control, and 20% get the new variation.
To solve this case, we recommend keeping the experiment spits equal, and adjusting the overall
exposure (ie, 20% exposure, 50/50 on each variation, so each variation gets 10%). This way the overall
exposure can be ramped up (or down) without having any users potentially switch variations.
## Metric selection
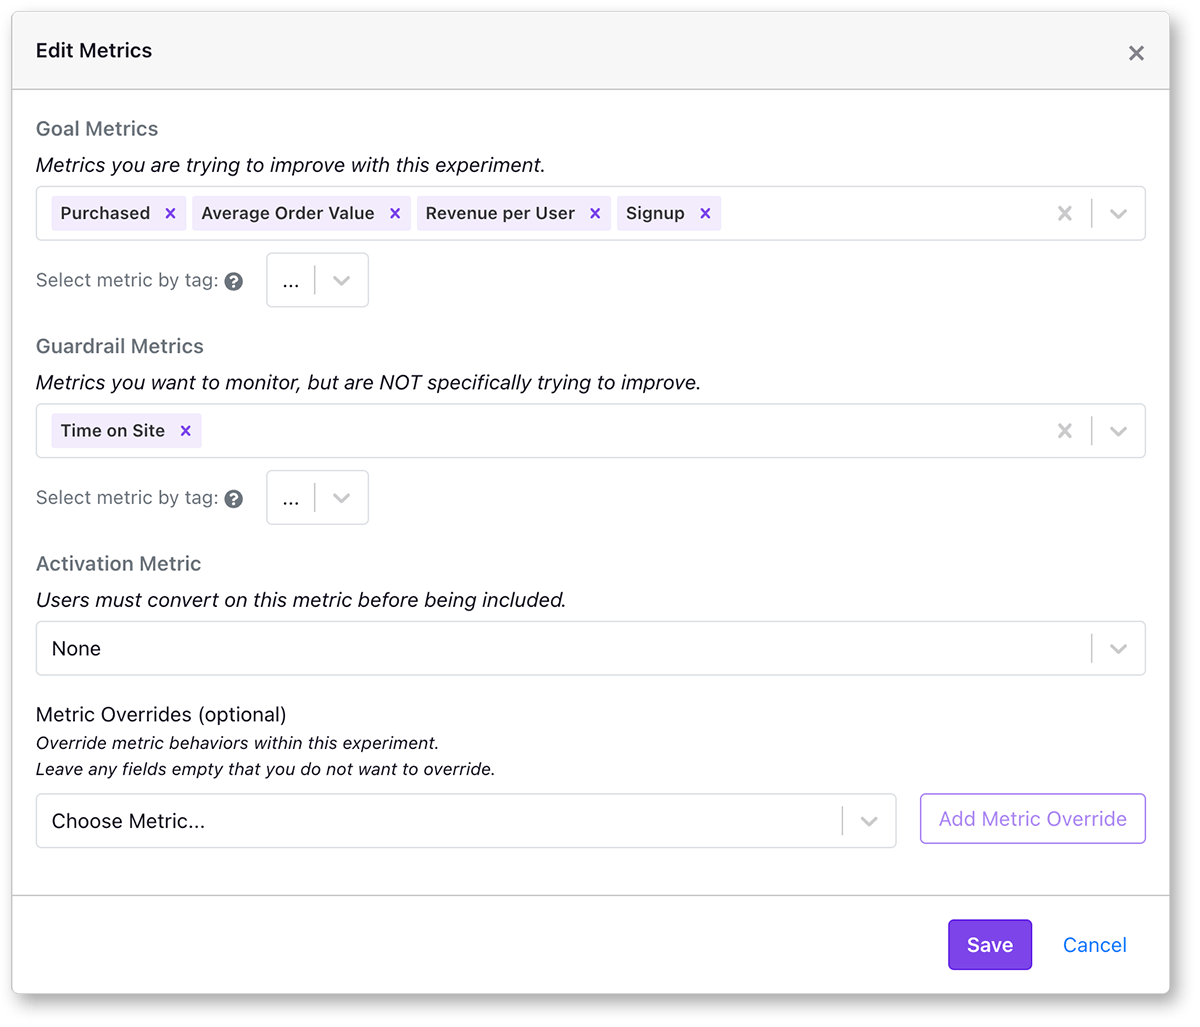
GrowthBook lets you choose goal metrics, secondary metrics, and guardrail metrics. Goal metrics are the metrics you’re
trying to improve or measure the impact of the change of your experiment.
Secondary metrics are used to learn about experiment impacts, but are not primary objectives. Guardrail metrics are
metrics you’re trying not to hurt.
 It is best to pick metrics for your experiment that are as close to your treatment as possible, and, if possible, the event itself. For
example, if you’re trying to improve a signup rate, you can add product review metrics that are close to
that event, like "signup modal open rate", and "signup conversion rate". You can add as many metrics as you
like to your experiment, but we suggest each experiment have only a few primary metrics that are used for
making the shipping decision. Adding all your metrics is not recommended, as this can lead to false
positives caused by random variations (see [Multiple testing problem](/using/experimentation-problems#multiple-testing-problem))
Before running a test, select a primary metric or set of metrics that you're
trying to improve. These metrics are often called the OEC for Overall Evaluation Criterion. It is
important to have this decided ahead of time so when you look at your experiment results you're not just shopping for metrics that confirm
your bias (see [confirmation bias](/using/experimentation-problems#confirmation-bias)).
With GrowthBook, Goal and guardrail metrics can be added retroactively to experiments, as long as
the data exists in your data warehouse. This allows you to reprocess old experiments if you add new
metrics or redefine a metric.
## Activation metrics
Assigning your audience to the experiment should happen as close to the test as possible to reduce
noise and increase power. However, there are times when running an experiment requires that users
be bucketed into variations before knowing that they are actually being exposed to the variation. One
common example of this is with website modals, where the modal code needs to be loaded on the
page with the experiment variations, but you’re not sure if each user will actually see the modal. With
activation metrics you can specify a metric that needs to be present to filter the list of exposed users to
just those with that event.
## Sample sizes and metric totals
When running an experiment you select your goal metrics. Getting enough samples depends on the
size of the effect you’re trying to detect. If you think the experiment will have a large effect, the smaller
total number of events you need to collect. GrowthBook allows users to set a minimum metric total for
each metric where we will hide results before that threshold is reached to avoid premature peeking.
## Test Duration
We recommend running an experiment for at least 1 or 2 weeks to capture variations in your traffic.
Before a test is significant, GrowthBook will give you an estimated time remaining before it reaches the
minimum thresholds. Traffic to your product is likely not uniform, and there may be differences
## Metric Windows
A lot can happen between when a user is exposed to an experiment, and when a metric event is
triggered. How you want to attribute that conversion event to the experiment is adjustable within
GrowthBook using metric and experiment level settings.
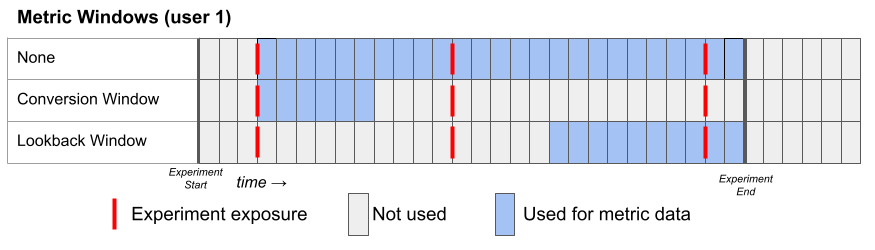
At the metric level, you can pick three different metric windows:
* None - uses as much data as possible from the user's exposure until the end of the experiment.
* Conversion - uses only data in some window after a user's first exposure. If the metric's conversion window is set to 72 hours, any conversion that happens after that is
ignored.
* Lookback - uses only data in the last window before an experiment ends.
Here's a representation of how these metric windows work for a hypothetical user:
It is best to pick metrics for your experiment that are as close to your treatment as possible, and, if possible, the event itself. For
example, if you’re trying to improve a signup rate, you can add product review metrics that are close to
that event, like "signup modal open rate", and "signup conversion rate". You can add as many metrics as you
like to your experiment, but we suggest each experiment have only a few primary metrics that are used for
making the shipping decision. Adding all your metrics is not recommended, as this can lead to false
positives caused by random variations (see [Multiple testing problem](/using/experimentation-problems#multiple-testing-problem))
Before running a test, select a primary metric or set of metrics that you're
trying to improve. These metrics are often called the OEC for Overall Evaluation Criterion. It is
important to have this decided ahead of time so when you look at your experiment results you're not just shopping for metrics that confirm
your bias (see [confirmation bias](/using/experimentation-problems#confirmation-bias)).
With GrowthBook, Goal and guardrail metrics can be added retroactively to experiments, as long as
the data exists in your data warehouse. This allows you to reprocess old experiments if you add new
metrics or redefine a metric.
## Activation metrics
Assigning your audience to the experiment should happen as close to the test as possible to reduce
noise and increase power. However, there are times when running an experiment requires that users
be bucketed into variations before knowing that they are actually being exposed to the variation. One
common example of this is with website modals, where the modal code needs to be loaded on the
page with the experiment variations, but you’re not sure if each user will actually see the modal. With
activation metrics you can specify a metric that needs to be present to filter the list of exposed users to
just those with that event.
## Sample sizes and metric totals
When running an experiment you select your goal metrics. Getting enough samples depends on the
size of the effect you’re trying to detect. If you think the experiment will have a large effect, the smaller
total number of events you need to collect. GrowthBook allows users to set a minimum metric total for
each metric where we will hide results before that threshold is reached to avoid premature peeking.
## Test Duration
We recommend running an experiment for at least 1 or 2 weeks to capture variations in your traffic.
Before a test is significant, GrowthBook will give you an estimated time remaining before it reaches the
minimum thresholds. Traffic to your product is likely not uniform, and there may be differences
## Metric Windows
A lot can happen between when a user is exposed to an experiment, and when a metric event is
triggered. How you want to attribute that conversion event to the experiment is adjustable within
GrowthBook using metric and experiment level settings.
At the metric level, you can pick three different metric windows:
* None - uses as much data as possible from the user's exposure until the end of the experiment.
* Conversion - uses only data in some window after a user's first exposure. If the metric's conversion window is set to 72 hours, any conversion that happens after that is
ignored.
* Lookback - uses only data in the last window before an experiment ends.
Here's a representation of how these metric windows work for a hypothetical user:
 Here's a second example for a hypothetical User 2, who joins the experiment late. Notice that the conversion window can extend beyond the experiment end date.
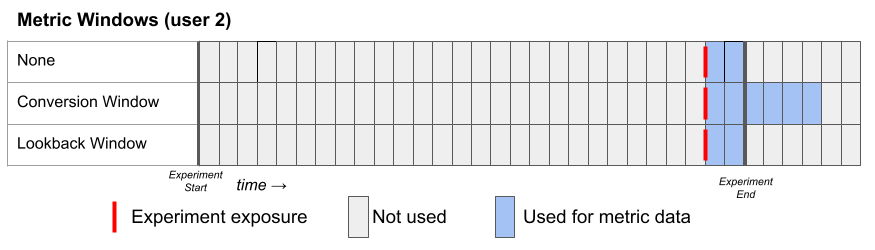 You can override all Conversion windows to be No window at the experiment level using the "Conversion Window Override" in the Experiment Analysis Settings.
## Understanding results
### Bayesian Results
In GrowthBook the experiment results will look like this.
You can override all Conversion windows to be No window at the experiment level using the "Conversion Window Override" in the Experiment Analysis Settings.
## Understanding results
### Bayesian Results
In GrowthBook the experiment results will look like this.
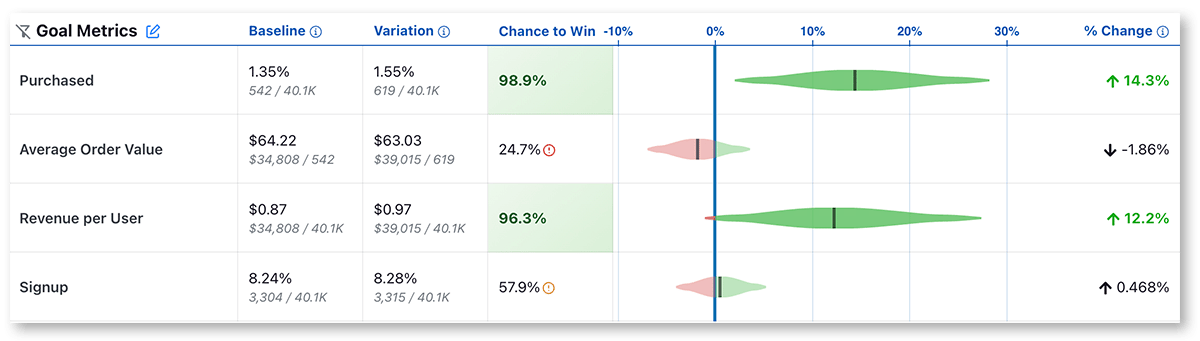 Each row of this table is a different metric. This is a simplified overview of the data. If you want to
see the full data, mouse over any of the results.
Each row of this table is a different metric. This is a simplified overview of the data. If you want to
see the full data, mouse over any of the results.
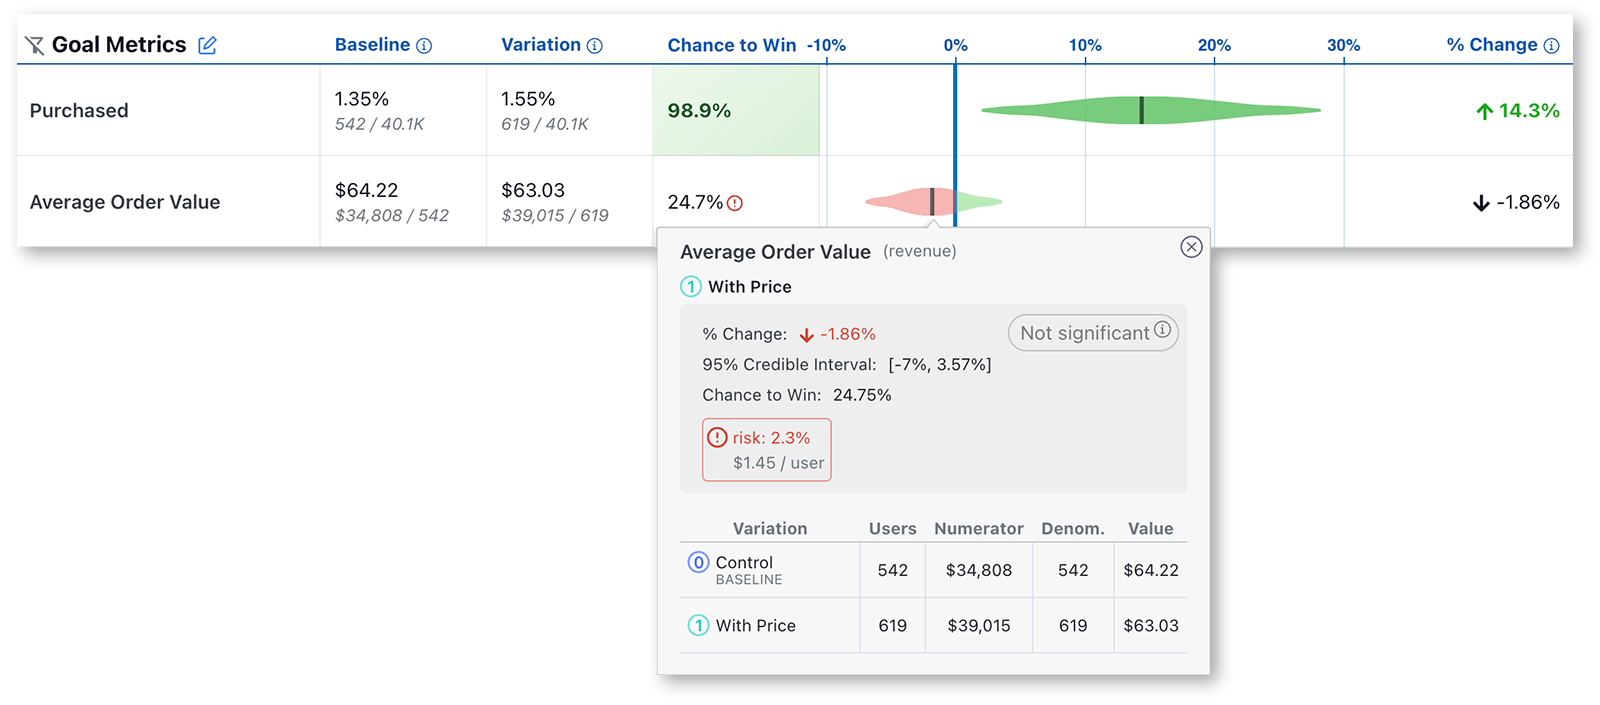 Value is the conversion rate or average value per user. In small print you can see the raw numbers
used to calculate this.
**Chance to Beat Control** tells you the probability that the variation is better. If you are familiar with
Frequentist statistics, you can consider this value 1 - the p value. Anything above the threshold (which
by default is set to 95%) is highlighted green indicating a very clear winner. Anything below the
threshold (5% by default) is highlighted red, indicating a very clear loser. Anything in between is gray
indicating it's inconclusive. If that's the case, there's either no measurable difference or you haven't
gathered enough data yet.
**Percent Change** shows how much better/worse the variation is compared to the control. It is a
probability density graph and the thicker the area, the more likely the true percent change will be
there. As you collect more data, the tails of the graphs will shorten, indicating more certainty around
the estimates.
### Frequentist Results
You can also choose to analyze results using a Frequentist engine that conducts simple t-tests for
differences in means and displays the commensurate p-values and confidence intervals.
If you selected the "Frequentist" engine, when you navigate to the results tab to view and update the
results, you will see the following results:
Value is the conversion rate or average value per user. In small print you can see the raw numbers
used to calculate this.
**Chance to Beat Control** tells you the probability that the variation is better. If you are familiar with
Frequentist statistics, you can consider this value 1 - the p value. Anything above the threshold (which
by default is set to 95%) is highlighted green indicating a very clear winner. Anything below the
threshold (5% by default) is highlighted red, indicating a very clear loser. Anything in between is gray
indicating it's inconclusive. If that's the case, there's either no measurable difference or you haven't
gathered enough data yet.
**Percent Change** shows how much better/worse the variation is compared to the control. It is a
probability density graph and the thicker the area, the more likely the true percent change will be
there. As you collect more data, the tails of the graphs will shorten, indicating more certainty around
the estimates.
### Frequentist Results
You can also choose to analyze results using a Frequentist engine that conducts simple t-tests for
differences in means and displays the commensurate p-values and confidence intervals.
If you selected the "Frequentist" engine, when you navigate to the results tab to view and update the
results, you will see the following results:
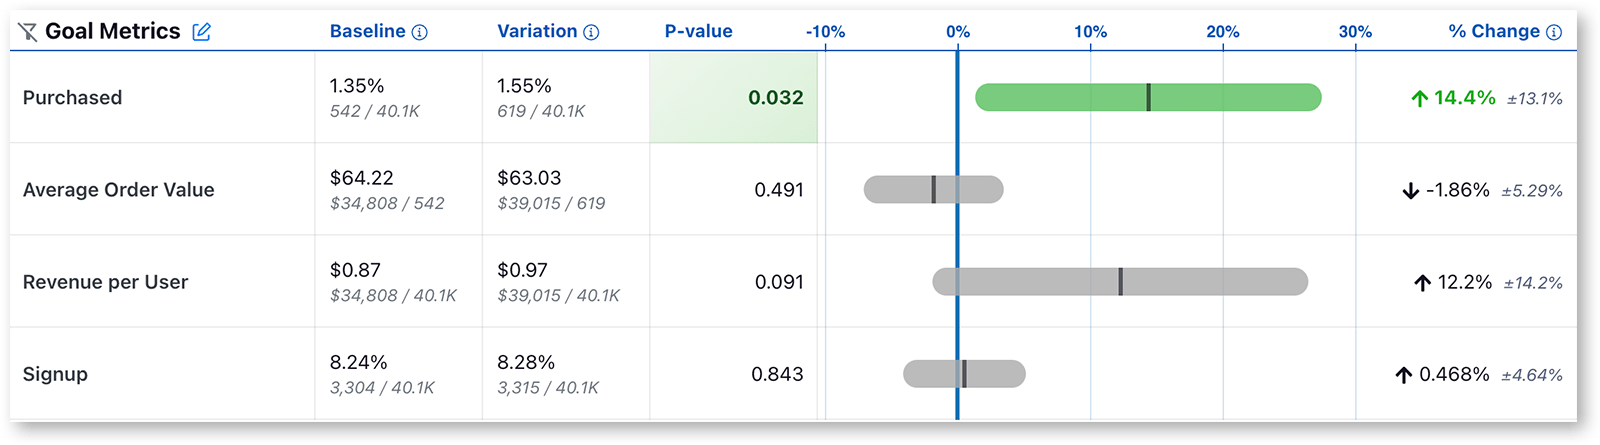 Everything is the same as above except for two key changes:
* The Chance to Beat Control column has been replaced with the P-value column. The p-value
is the probability that the percent change for a variant would have been observed if the true
percent change were zero. When the p-value is less than the threshold (default to 0.05) and the
percent change is in the preferred direction, we highlight the cell green, indicating it is a clear
winner. When the p-value is less than the threshold and the percent change is opposite the
preferred direction, we highlight the cell red, indicating the variant is a clear loser on this metric.
* We now present a 95% confidence interval rather than a posterior probability density plot.
## Data quality checks
GrowthBook performs automatic data quality checks to ensure the statistical inferences are valid and
ready for interpretation. You can check and monitor the health of your experiments on the
experiment **health page**.
### Health Page
GrowthBook automatically does data quality checks on all experiments and shows the results on the **Health Page**.
Everything is the same as above except for two key changes:
* The Chance to Beat Control column has been replaced with the P-value column. The p-value
is the probability that the percent change for a variant would have been observed if the true
percent change were zero. When the p-value is less than the threshold (default to 0.05) and the
percent change is in the preferred direction, we highlight the cell green, indicating it is a clear
winner. When the p-value is less than the threshold and the percent change is opposite the
preferred direction, we highlight the cell red, indicating the variant is a clear loser on this metric.
* We now present a 95% confidence interval rather than a posterior probability density plot.
## Data quality checks
GrowthBook performs automatic data quality checks to ensure the statistical inferences are valid and
ready for interpretation. You can check and monitor the health of your experiments on the
experiment **health page**.
### Health Page
GrowthBook automatically does data quality checks on all experiments and shows the results on the **Health Page**.
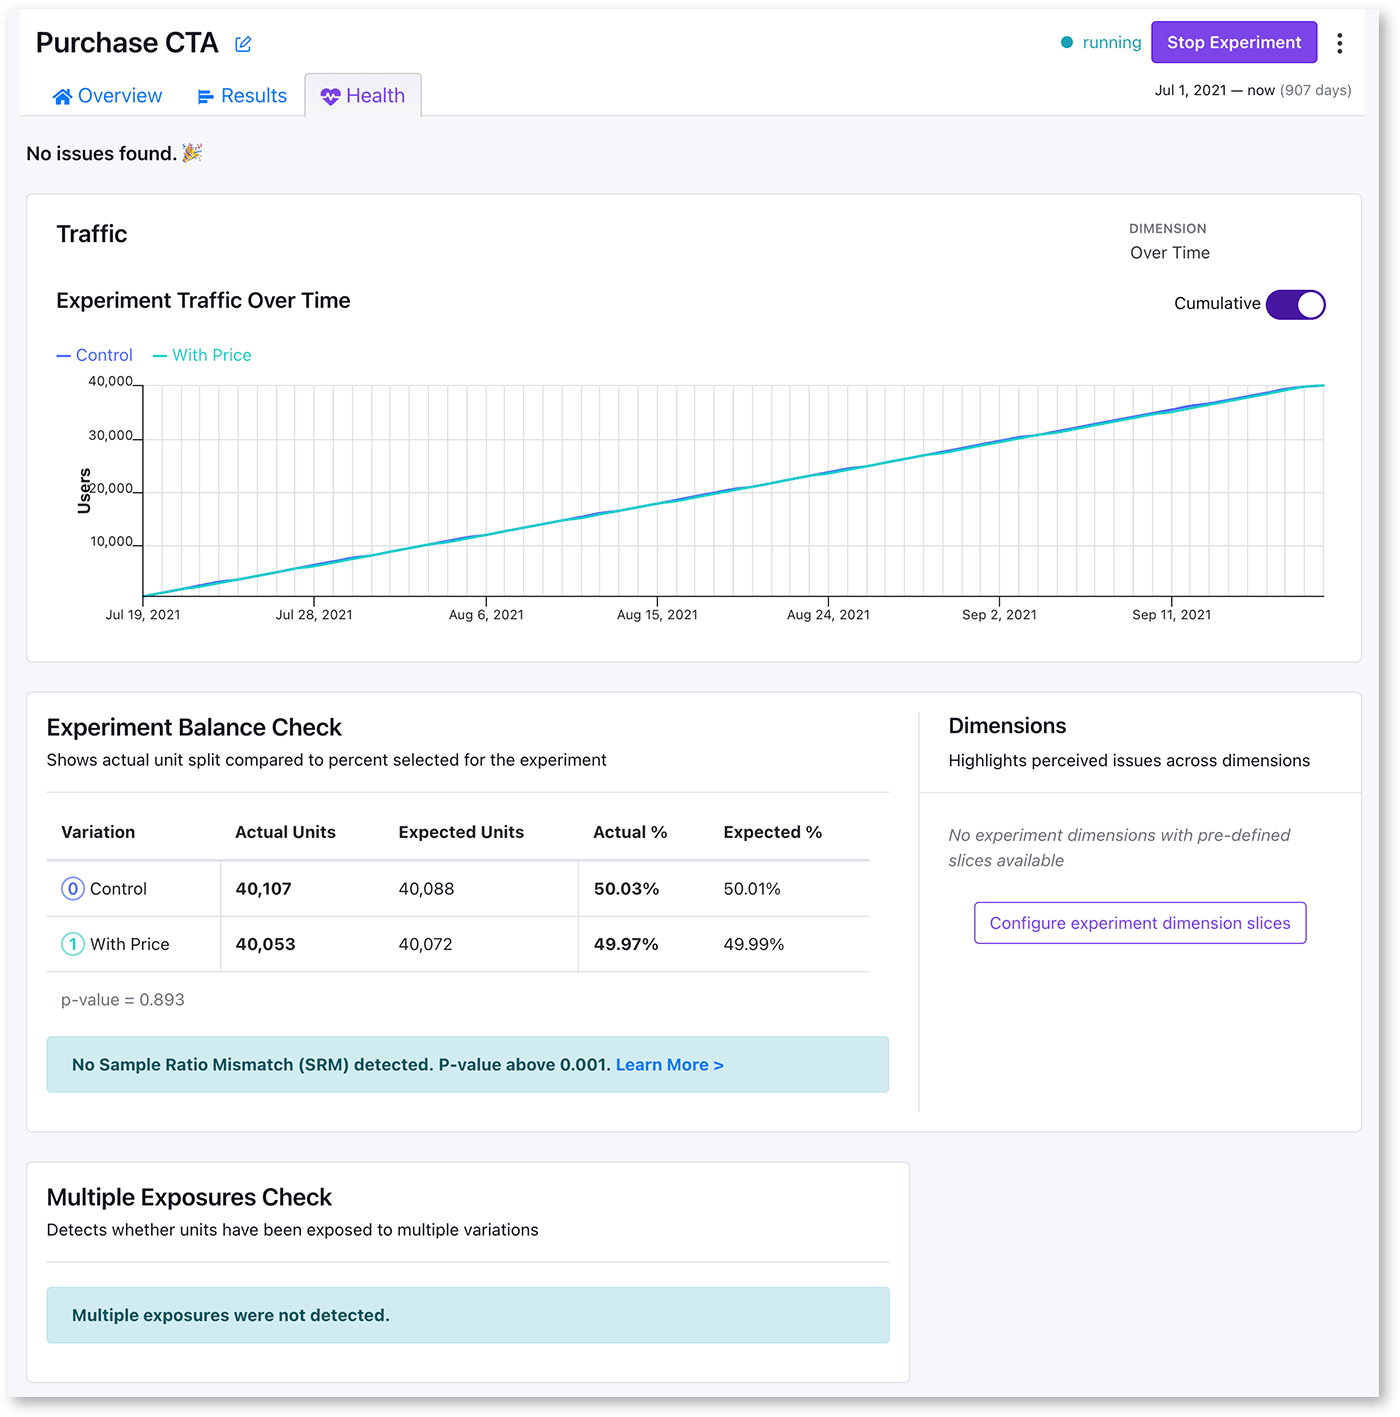 This page shows experiment exposure over time, and also all the other health checks we do.
### Little traffic in experiment
Experiment Traffic Over Time shows how many users are in the experiment at a given timepoint. If traffic is too low, please see our [troubleshooting guide](/kb/experiments/troubleshooting-experiments#problem-1-no-or-little-traffic-flowing-into-the-experiment).
### Sample Ratio Mismatch (SRM)
Every experiment automatically checks for a Sample Ratio Mismatch and will warn you if found.
This happens when you expect a certain traffic split (e.g. 50/50) but you see something significantly
different (e.g. 46/54). We only show this warning if the p-value is less than 0.001, which means it's
extremely unlikely to occur by chance. We will show this warning on the results page, and also on our
experiment health page.
This page shows experiment exposure over time, and also all the other health checks we do.
### Little traffic in experiment
Experiment Traffic Over Time shows how many users are in the experiment at a given timepoint. If traffic is too low, please see our [troubleshooting guide](/kb/experiments/troubleshooting-experiments#problem-1-no-or-little-traffic-flowing-into-the-experiment).
### Sample Ratio Mismatch (SRM)
Every experiment automatically checks for a Sample Ratio Mismatch and will warn you if found.
This happens when you expect a certain traffic split (e.g. 50/50) but you see something significantly
different (e.g. 46/54). We only show this warning if the p-value is less than 0.001, which means it's
extremely unlikely to occur by chance. We will show this warning on the results page, and also on our
experiment health page.
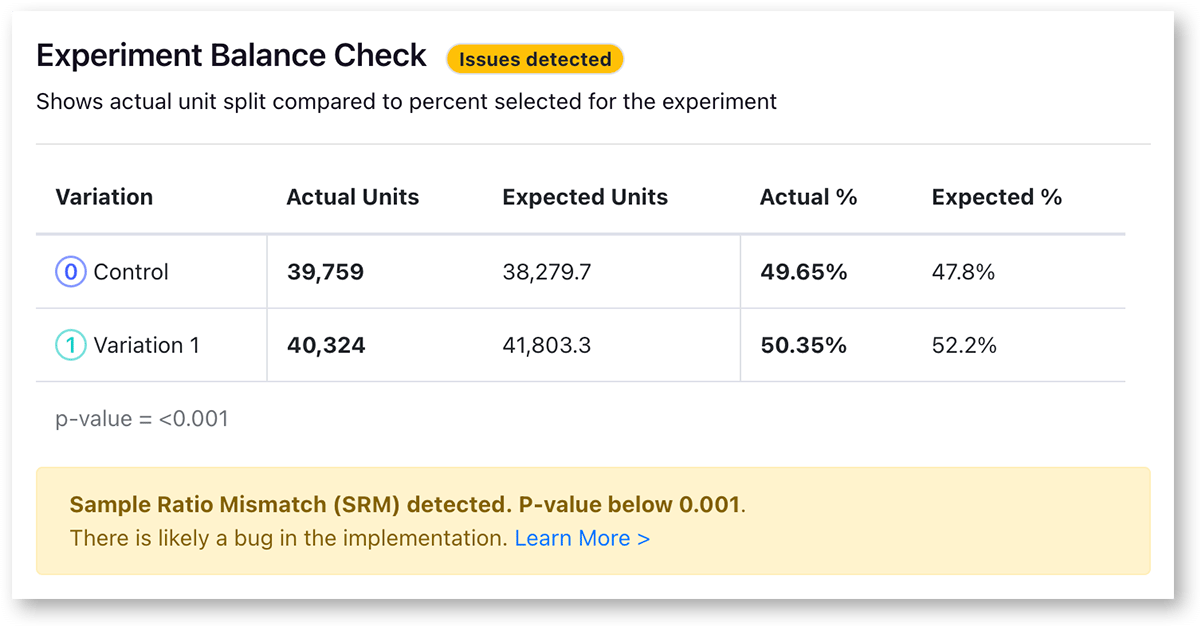 Like the warning says, you shouldn't trust the results since they are likely misleading. Instead, find and
fix the source of the bug and restart the experiment. You can find more information about potential sources
of the problems in our [troubleshooting guide](/kb/experiments/troubleshooting-experiments#problem-2-srm-errors-traffic-imbalance-in-the-experiment).
### Multiple Exposures
We also automatically check each experiment to make sure that too many users have not been
exposed to multiple variations of a single experiment. This can happen if the hashing attribute is
different from the assignment id used in the report, or for implementation problems. Please see our [troubleshooting guide](/kb/experiments/troubleshooting-experiments#problem-3-multiple-exposures).
### Minimum Data Thresholds
You can set thresholds per metric to make sure people viewing the results aren’t drawing conclusions
too early (e.g. when it’s 5 vs 2 conversions)
### Variation Id Mismatch
GrowthBook can detect missing or improperly-tagged rows in your data warehouse. The most common
way this can happen if you assign with one parameter, but send a different ID to your warehouse
from the trackingCallback call. It may indicate that your variation assignment tracking is not
working properly.
### Suspicious Uplift Detection
You can set thresholds per metric for a maximum percent change. When a metric results is above this,
GrowthBook will show an alert. Large uplifts may indicate a bug - see [Twymans Law](/using/experimentation-problems#twymans-law).
### Guardrails
Guardrail metrics are ones that you want to keep an eye on, but aren't trying to specifically improve with your
experiment. For example, if you are trying to improve page load times, you may add revenue as a
guardrail since you don't want to inadvertently harm it.
Guardrail results show up beneath the main table of goal and secondary metrics. The full statistics are shown like
goal metrics, and similarly they are colored based on "Chance to Beat Control". If guardrail metrics
become significant, you may want to consider ending the experiment.
Like the warning says, you shouldn't trust the results since they are likely misleading. Instead, find and
fix the source of the bug and restart the experiment. You can find more information about potential sources
of the problems in our [troubleshooting guide](/kb/experiments/troubleshooting-experiments#problem-2-srm-errors-traffic-imbalance-in-the-experiment).
### Multiple Exposures
We also automatically check each experiment to make sure that too many users have not been
exposed to multiple variations of a single experiment. This can happen if the hashing attribute is
different from the assignment id used in the report, or for implementation problems. Please see our [troubleshooting guide](/kb/experiments/troubleshooting-experiments#problem-3-multiple-exposures).
### Minimum Data Thresholds
You can set thresholds per metric to make sure people viewing the results aren’t drawing conclusions
too early (e.g. when it’s 5 vs 2 conversions)
### Variation Id Mismatch
GrowthBook can detect missing or improperly-tagged rows in your data warehouse. The most common
way this can happen if you assign with one parameter, but send a different ID to your warehouse
from the trackingCallback call. It may indicate that your variation assignment tracking is not
working properly.
### Suspicious Uplift Detection
You can set thresholds per metric for a maximum percent change. When a metric results is above this,
GrowthBook will show an alert. Large uplifts may indicate a bug - see [Twymans Law](/using/experimentation-problems#twymans-law).
### Guardrails
Guardrail metrics are ones that you want to keep an eye on, but aren't trying to specifically improve with your
experiment. For example, if you are trying to improve page load times, you may add revenue as a
guardrail since you don't want to inadvertently harm it.
Guardrail results show up beneath the main table of goal and secondary metrics. The full statistics are shown like
goal metrics, and similarly they are colored based on "Chance to Beat Control". If guardrail metrics
become significant, you may want to consider ending the experiment.
 If you select the frequentist engine, we instead use yellow to represent a metric moving in the wrong
direction at all (regardless of statistical significance), red to represent a metric moving in the wrong
direction with a two-sided t-test p-value below 0.05, and green to represent a metric moving in the
right direction with a p-value below 0.05. Otherwise the cell is unshaded if the metric is moving in the
right direction but not statistically significant at the 0.05 level.
## Digging deeper
GrowthBook lets you dig into the results to get a better understanding of the likely effect of your
change.
### Segmentation
**Segments are deprecated**
Segments have been deprecated and are being phased out. If you don't already have one configured, you
shouldn't create one. Use a [Dimension](/app/dimensions) instead, or apply a custom SQL filter in the
experiment's analysis settings to only show users that match a particular attribute.
Previously, Segments could be applied to experiment results to only show users that match a particular
attribute. For example, you might have “country” as a dimension, and create a segment for just “US
visitors”. In the experiment you could configure the experiment to just look at one particular segment
of users. If you need this kind of filtering today, a custom SQL filter in the experiment's analysis
settings is the recommended approach, as long as the attribute you want to filter on already exists on
your experiment assignment query.
### Dimensions
GrowthBook lets you break down results by any dimension you know about your users. We
automatically let you break down by date, and any additional dimensions can be added either with
the exposure query, or with custom SQL from the dimension menu. Some examples of common
dimensions are “Browser” or “location”. You can read more about [dimensions here](/app/dimensions).
If you select the frequentist engine, we instead use yellow to represent a metric moving in the wrong
direction at all (regardless of statistical significance), red to represent a metric moving in the wrong
direction with a two-sided t-test p-value below 0.05, and green to represent a metric moving in the
right direction with a p-value below 0.05. Otherwise the cell is unshaded if the metric is moving in the
right direction but not statistically significant at the 0.05 level.
## Digging deeper
GrowthBook lets you dig into the results to get a better understanding of the likely effect of your
change.
### Segmentation
**Segments are deprecated**
Segments have been deprecated and are being phased out. If you don't already have one configured, you
shouldn't create one. Use a [Dimension](/app/dimensions) instead, or apply a custom SQL filter in the
experiment's analysis settings to only show users that match a particular attribute.
Previously, Segments could be applied to experiment results to only show users that match a particular
attribute. For example, you might have “country” as a dimension, and create a segment for just “US
visitors”. In the experiment you could configure the experiment to just look at one particular segment
of users. If you need this kind of filtering today, a custom SQL filter in the experiment's analysis
settings is the recommended approach, as long as the attribute you want to filter on already exists on
your experiment assignment query.
### Dimensions
GrowthBook lets you break down results by any dimension you know about your users. We
automatically let you break down by date, and any additional dimensions can be added either with
the exposure query, or with custom SQL from the dimension menu. Some examples of common
dimensions are “Browser” or “location”. You can read more about [dimensions here](/app/dimensions).
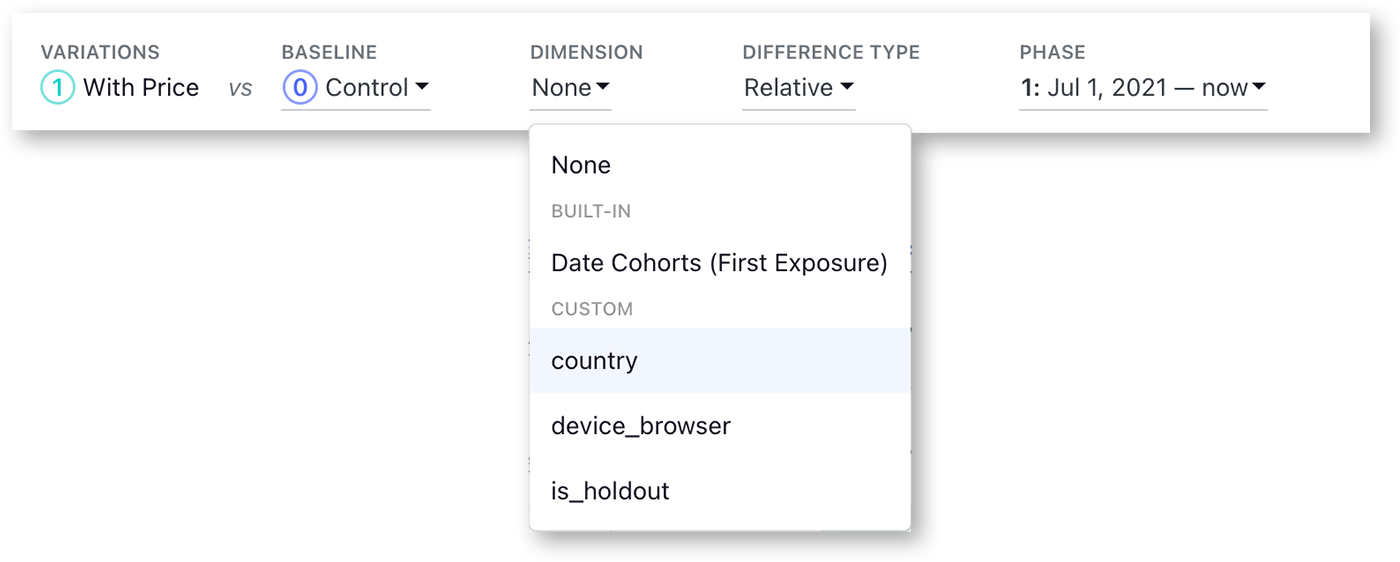 It can be very helpful to look into how specific dimensions of your users are affected by the
experiment. For example, you may discover that a specific browser is underperforming compared to
the rest, and this may indicate a bug, or something to investigate further.
The more metrics and dimensions you look at, the more likely you are to see a false positive. If you find
something that looks surprising, it's often worth a dedicated follow-up experiment to verify that it's real.
### Custom reports
Custom reports create snapshots of experiment results, allowing you to capture and share specific analyses or points in time.
Common use cases for custom reports include:
* Capturing milestone results at specific points in the experiment
* Analyzing specific date ranges or segments
* Adding or removing metrics for focused analysis
* Applying custom SQL filters to handle outliers
* Creating targeted views for different stakeholders
* Documenting key findings for future reference
It can be very helpful to look into how specific dimensions of your users are affected by the
experiment. For example, you may discover that a specific browser is underperforming compared to
the rest, and this may indicate a bug, or something to investigate further.
The more metrics and dimensions you look at, the more likely you are to see a false positive. If you find
something that looks surprising, it's often worth a dedicated follow-up experiment to verify that it's real.
### Custom reports
Custom reports create snapshots of experiment results, allowing you to capture and share specific analyses or points in time.
Common use cases for custom reports include:
* Capturing milestone results at specific points in the experiment
* Analyzing specific date ranges or segments
* Adding or removing metrics for focused analysis
* Applying custom SQL filters to handle outliers
* Creating targeted views for different stakeholders
* Documenting key findings for future reference
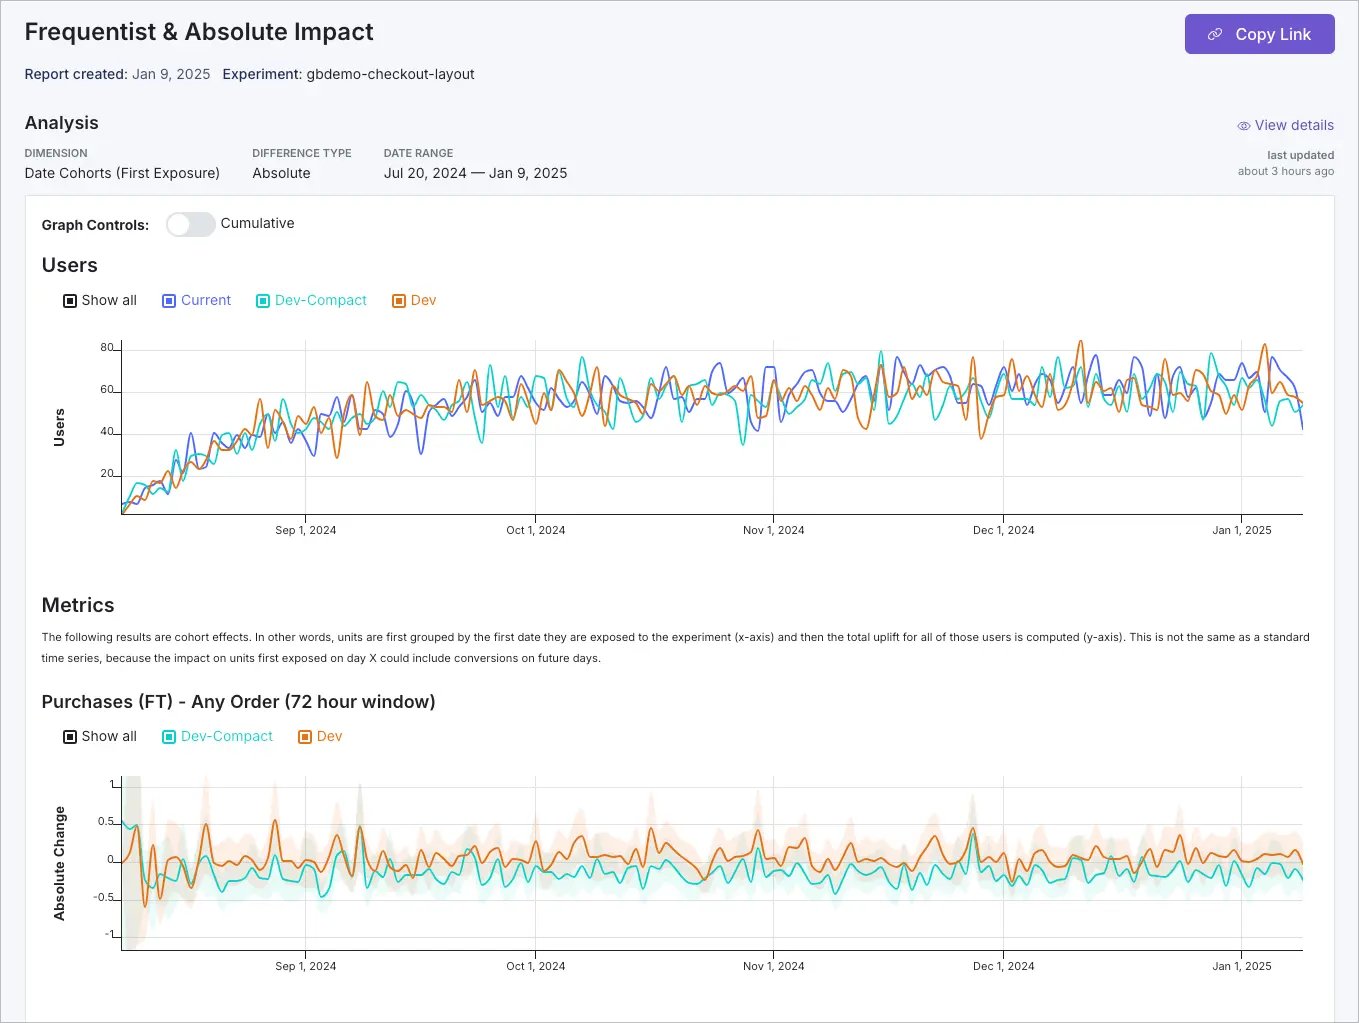 For step-by-step instructions on creating and managing custom reports, see our [Sharing Experiment Insights](/app/experiment-results#sharing-experiment-insights) documentation.
## Deciding A/B test results
Hopefully you are analysing your experiment results with your OEC already documented. Even so, when
to stop, and how to interpret results may not be straight forward.
### When to stop an experiment
When using the Bayesian statistics engine, there are a few methods you can use when stopping a test.
* significance reached on your primary metrics
* confidence intervals do not include harmful outcomes
* guardrail metrics are not affected
* test duration reached
It all depends on what you’re trying to do with the experiment. For example, if you’d like to know what
impact your change has, you should use the first method. If you’re doing a design change, and want to
make sure you haven’t broken anything on your product, you can use the guard rail approach.
You should also make sure that the experiment has run for your minimum test duration (typically 1 or 2
weeks), so that you’re not looking at highly skewed sampling.
For Frequentist statistics, you should determine the running time of the experiment and stop the test at
that fixed horizon to ensure accurate results (see [Peeking](/using/experimentation-problems#peeking))
or use Sequential analysis.
### Interpreting results
It is quite common to have experiment results with mixed results. Deciding on the results of an
experiment in these cases may require some interpretation. As a general rule, you should have one
goal metric that is the primary metric you’re trying to improve, and if this metric is up significantly it is
generally straightforward to declare a result. If you have a mix and up and down metrics, the decisions
are less clear.
Once you have reached a decision with your experiment, you can click the “mark as finished” link
towards the top of the results. This will open a modal where you can document the results, including
the result, and observations.
This creates a card on the top of the experiment results with your conclusion.
Please note that currently this marking a test as finished does not stop the test from running. If you are
using feature flags to run the experiment, you should also go to the feature and turn off the experiment.
### Inconclusive results
Sometimes you may have an experiment that is inconclusive. Generally it is a good idea to have a policy
of what to do in these cases. We suggest that your policy should be to revert to the control variant in
these cases, unless the new version unlocks some new features.
For step-by-step instructions on creating and managing custom reports, see our [Sharing Experiment Insights](/app/experiment-results#sharing-experiment-insights) documentation.
## Deciding A/B test results
Hopefully you are analysing your experiment results with your OEC already documented. Even so, when
to stop, and how to interpret results may not be straight forward.
### When to stop an experiment
When using the Bayesian statistics engine, there are a few methods you can use when stopping a test.
* significance reached on your primary metrics
* confidence intervals do not include harmful outcomes
* guardrail metrics are not affected
* test duration reached
It all depends on what you’re trying to do with the experiment. For example, if you’d like to know what
impact your change has, you should use the first method. If you’re doing a design change, and want to
make sure you haven’t broken anything on your product, you can use the guard rail approach.
You should also make sure that the experiment has run for your minimum test duration (typically 1 or 2
weeks), so that you’re not looking at highly skewed sampling.
For Frequentist statistics, you should determine the running time of the experiment and stop the test at
that fixed horizon to ensure accurate results (see [Peeking](/using/experimentation-problems#peeking))
or use Sequential analysis.
### Interpreting results
It is quite common to have experiment results with mixed results. Deciding on the results of an
experiment in these cases may require some interpretation. As a general rule, you should have one
goal metric that is the primary metric you’re trying to improve, and if this metric is up significantly it is
generally straightforward to declare a result. If you have a mix and up and down metrics, the decisions
are less clear.
Once you have reached a decision with your experiment, you can click the “mark as finished” link
towards the top of the results. This will open a modal where you can document the results, including
the result, and observations.
This creates a card on the top of the experiment results with your conclusion.
Please note that currently this marking a test as finished does not stop the test from running. If you are
using feature flags to run the experiment, you should also go to the feature and turn off the experiment.
### Inconclusive results
Sometimes you may have an experiment that is inconclusive. Generally it is a good idea to have a policy
of what to do in these cases. We suggest that your policy should be to revert to the control variant in
these cases, unless the new version unlocks some new features.