;
};
Quantile Testing is incompatible with Mixpanel or MySQL integrations.
## What is a quantile test?
Quantile tests, also known as percentile tests, compare quantiles across variations. In contrast, standard GrowthBook A/B tests compare means across variations. For example, suppose that treatment increases user spend. Suppose that 90% of users in control spend at most \$50 per visit, and 90% of users in treatment spend at most \$55 per visit. Then the quantile treatment effect at the 90th percentile (i.e., P90) is \$55 - \$50 = \$5. Quantiles are commonly used in many applications where very large or small values are of interest (webpage latency, birth weight, blood pressure).
## When should I run quantile tests?
Below are two scenarios where you should run quantile tests.
Scenario 1: your website has low latency for most users, but for 1% of users it takes a long time for the page to load. You have a potential solution that targets improvements for this small fraction, and run an A/B test to confirm. Mean differences across variations may be noisy and provide uncertain conclusions, as your solution does not improve latency for most users. Running a quantile test at the 99th percentile can be more informative, as it helps detect if users that would have experienced the largest latency had their latency reduced.
Scenario 2: you have a new ad campaign designed to increase customer spend. You run an A/B test, and while the lift is positive, it is not statistically significant. Quantile tests can help you deep dive which subpopulations were positively affected by treatment. For example, you may see no improvement at P50, but moderate improvement at P99. This would indicate that the new campaign did not affect most users, but had a strong affect on your top spending users. In summary, quantile tests can complement mean tests.
## How do I interpret quantile test results?
Suppose you are running an A/B test designed to reduce website latency. Your effect estimate and 95% confidence interval (in milliseconds) for latency at P99 is -7 ms (-9 ms, -5 ms). How do you interpret this?
Consider one universe where **all** customers received control (not just the customers assigned to control). In this universe, website latency for 99% of customers is no more than 145 ms. That is, P99 for control is 145 ms.
Consider another universe where **all** customers are assigned to treatment. In the treatment universe, website latency for 99% of customers is no more than 139 ms. So the true effect at P99 is 139 ms - 145 ms = -6 ms.
A quantile test tries to estimate this difference. You interpret the interval above as “There is a 95% chance that the difference in P99 latencies across the groups is in (-9ms, -5ms)”.
## Should I aggregate by experiment user before taking quantile?
Below we describe how quantile testing differs in event- vs user-level analyses. Suppose that your new feature is designed to lower webpage request times. If you want to reduce the largest request times across all web sessions, then use quantile testing for event-level data. This can help you learn if your new feature reduced the 99th percentile of request times. If you want to reduce total request times for your most frequent customers, then use quantile testing for user-level data. Here GrowthBook sums the total request times for all events within a customer, then compares percentiles of these sums across variations.
Sometimes it can be hard to choose whether or not to aggregate.\
Another consideration is how the metric is typically conceptualized.\
Aggregation is usually correct if your metric is often conceptualized at the customer level (e.g., customer spend during a week).
Aggregation is usually inappropriate if your metric is often conceptualized at the event level (e.g., spend per order).
To illustrate the mathematics behind the two approaches, consider an experiment where we collected the following data for all users in a variation.
| user\_id | value |
| -------- | ----- |
| 123 | 0 |
| 123 | 0 |
| 456 | 2 |
| 456 | 3 |
| 789 | 99 |
Taking the median (P50) under each approach gives different results:
| Quantile Type | P50 | Formula |
| ------------- | --- | ------------------------------------------ |
| Event | 2 | `APPROX_PERCENTILE([0, 0, 2, 3, 99], 0.5)` |
| Per-User | 5 | `APPROX_PERCENTILE([0, 5, 99], 0.5)` |
Notice that for the Per-User quantile, we sum values at the user level first (user 123: 0, user 456: 5, user 789: 99) before passing them to the percentile function. `NULL` values are always ignored.
## How do I run a quantile test in GrowthBook?
Running a quantile test is just as easy as running a mean test.
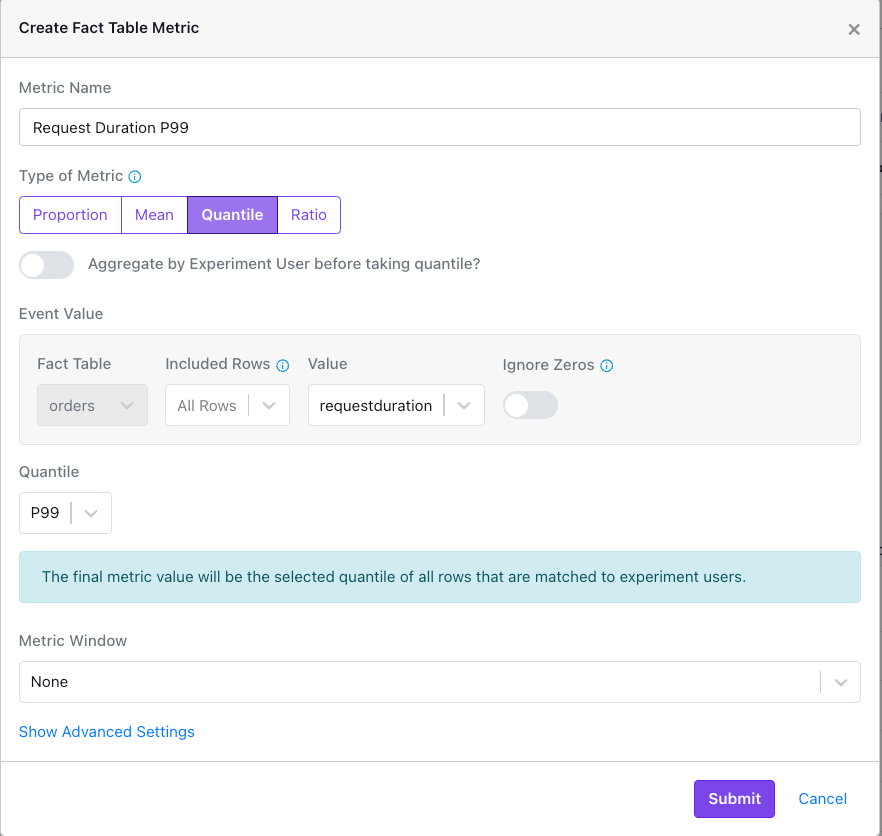
1. Navigate to your [Fact Table](/app/metrics) and select "Add Metric".
2. Select “Quantile” from “Type of Metric”.
3. Toggle “Aggregate by Experiment User before taking quantile” if you want to compare quantiles across variations at the user granularity, after summing row values at the user level. The default is at the event granularity.
4. Pick your quantile level from the defaults (p50, p90, p95, p99) or use a custom value. Guidance describing the range of available values is in our [FAQ](#faq) at the bottom of this page.
5. Decide whether you want zeros to be included in the analysis (see [FAQ](#faq) at the bottom of this page).
6. Select your metric window as you would for a mean test.
7. Submit!
## GrowthBook implementation
Here we describe technical details of our implementation.
GrowthBook implements the approach first introduced in [Deng, Knoblich and Yu (2018)](https://alexdeng.github.io/public/files/kdd2018-dm.pdf).
This clever approach has two key advantages. First, it constructs valid confidence intervals for quantiles that uses only sample quantiles, rather than all of the data. This permits estimation using only a single pass through the data. Second, it provides quantile inference for clustered data. This is helpful when randomization occurs at the user level, but our metrics are measured at the session level (described
[here](#should-i-aggregate-by-experiment-user-before-taking-quantile)). Our implementation is based upon Algorithm 1 of [Yao, Li and Lu (2024)](https://arxiv.org/pdf/2401.14549.pdf). Define $\nu \in (0, 1)$ as the quantile level of interest. Define $\alpha \in (0,1)$ as the false positive rate, and let $Z_{1-\alpha/2}$ be its associated critical value. Without loss of generality we focus on the control variation. Let $n$ be the control sample size. Define $Y_{ij}$ as the webpage latency for the $j^{\text{th}}$ session for the $i^{\text{th}}$ user (i.e., cluster) in control, $j=1,2,…, N_{i}$, $i=1,2,…,K$. Define the observed control outcomes as $\left\{Y_{1}, Y_{2}, ..., Y_{n}\right\}$, where $n=\sum_{i=1}^{K}N_{i}$. Define the ordered (from smallest to largest) control outcomes as $\left\{Y_{(1)}, Y_{(2)}, ..., Y_{(n)}\right\}$.
1. Compute L, U = $n\left(\nu \pm Z_{1-\alpha/2}\sqrt{\nu(1-\nu)/n} \right)$.
2. Fetch $Y_{n\nu}, Y_{L}, Y_{U}$.
3. Compute $I_{ij} = 1\left\{Y_{ij}\leq Y_{n\nu}\right\}$. Define $\bar{I} = n^{-1}\sum_{i=1}^{K}\sum_{j=1}^{N_{i}}I_{ij}$.
4. Compute $\sigma_{I, \text{iid}}^{2} = \nu(1-\nu)/n$, an estimate of the variance of $\bar{I}$ assuming independent and identically distributed (iid) errors.
5. Define $\sigma_{I, c}^{2} = \text{Var}(\bar{I})$ using the variance of ratios of means described below.
6. Compute $\sigma_{iid}^{2} = \left(\frac{Y_{U}-Y_{L}}{2Z_{1-\alpha/2}}\right)^{2}$ .
7. The cluster-adjusted variance is $\sigma_{\text{iid}}^{2} \left(\sigma_{I,\text{iid}}^{2}/\sigma_{I,c}^{2}\right)$. The term in parentheses adjusts the variance for clustering. If there is no clustering (i.e., inference is at the user level), then use $\sigma_{iid}^{2}$.
To further speed this algorithm, instead of finding the exact $(L, U)$, which requires pre-computing $n$ inside of SQL, we instead construct a sequence of logarithmically increasing sample sizes $N^{\star}=\left\{n_{1}, n_{2}, ... n_{M}\right\}$ and their associated intervals$\left\{(L_{1}, U_{1}), (L_{2}, U_{2}), ..., (L_{M}, U_{M}) \right\}$. We then output the quantiles associated with each interval, as well as $n$. We then find $n^{\star}$, defined as the largest element of $N^{\star}$ such that $n^{\star}\leq n$. We then adjust the variance outputted by the algorithm above by a factor of $n^{\star}/n$. Currently we use 20 different values of $N^{\star}$, where the $k^{\text{th}}$ value is equal to $100 * 2 ^{k-1}$.
In this paragraph we describe the variance of a ratio of means, as described in step 5. above. Additionally, this is the standard formula used to calculate variance of a mean for a variation in GrowthBook t-tests. Here we define the user outcome in terms of random variable $X_{i}$, as the formula below can be used for any outcome (e.g., $Y_{ij}$, $I_{ij}$, etc.). For the $i^{\text{th}}$ user define the sum of outcomes $S_{i} = \sum_{j=1}^{N_{i}}Y_{ij}$. Then the mean outcomes across users is $\bar{X}=\frac{\sum_{i=1}^{K}S_{i}}{\sum_{i=1}^{K}N_{i}}$. Define the mean sum of latencies across users as $\bar{S} = K^{-1}\sum_{i=1}^{K}S_{i}$. Define the mean sum of sessions across users as $\bar{N} = K^{-1}\sum_{i=1}^{K}N_{i}$. A formula for the variance of $\bar{X}$ is
$\text{Var}\left(\bar{X}\right) = \frac{1}{K\bar{N}^{2}}\left[\text{Var}(S)-2\frac{\bar{S}}{\bar{N}}\text{Cov}(S,N)+\frac{\bar{S}^2}{\bar{N}^2}\text{Var}(N)\right]$.
This is similar to the delta method approximation of the variance we use for ratio metrics and for relative effects.
Let $\hat{\mu}_{C,n\nu}$ be the $\nu^{\text{th}}$ sample quantile for control, and let its associated variance be $\hat\sigma^2_{C,n\nu}$.
Analogously define $\hat{\mu}_{T,n\nu}$ and $\hat\sigma^2_{C,n\nu}$ for treatment. These quantities are plugged into our lift estimators as described in the [Statistical Details](/statistics/details) page. The result
from step 7 is our estimate of the variance and the sample quantile is directly computed in the SQL query.
## FAQ
Frequently asked questions:
1. Can I pick any quantile level (e.g., P99.999)? No - the maximum range available is \[0.001, 0.999], and that is only for experiments with large sample sizes (i.e., n > 3838). This is because inference can become unreliable for extreme quantile levels and small sample sizes. In general, if you want to compare quantiles at some value $p \in (0, 1)$, and you want a 95% confidence interval, your sample size $n$ must be bigger than $4p/(1-p)$. Similarly, if you want extreme and small quantiles, you need $n \geq 4(1-p)/p$. For $p=0.99$ and $p=0.01$, this corresponds to $n \geq 380$.
2. Should I include zeros in my quantile test? This depends upon the population that you care about, and what you want to learn. If zero is a common value for your metric, then P90 including zeros can be much less than P90 without zeros. If your metric is typically conceptualized and reported with zeros included, then it will probably makes sense to include zeros in your quantile test metric. If you are using quantile tests to deep dive mean test results, then use the same configuration for both tests.
3. Can I get quantile test results inside of a Bayesian framework? Yes - GrowthBook puts a prior on the quantile treatment effect, and combines this prior with the effect estimate to obtain a posterior distribution for the quantile treatment effect. So “Chance to Win” and other helpful Bayesian concepts are available.
4. How does quantile inference connect to mean inference? If you average the quantiles of a distribution, you get the distributional mean. That is, the average of $\left\{P1, P2, ..., P98, P99\right\}$ equals the mean of the distribution. Similarly, the average of the treatment effects at P1, P2, etc. equals the mean treatment effect. So quantile inference can be viewed as a decomposition of mean inference.
5. How should I conduct quantile inference in the presence of percentile capping? We have disabled percentile capping for quantile testing. For example, if you picked P99 for your quantile level, then your results could be biased, as capping at P98 ignores all information beyond the 98th percentile. Percentile capping at P98 does not affect estimates at any quantile level below P98 (e.g., P50, P90), so percentile capping will either do nothing or potentially bias quantile test results.
6. How does Quantile Testing intersect with [CUPED](/statistics/cuped), [Multiple Testing Corrections](/statistics/multiple-corrections), and [Sequential Testing](/statistics/sequential)? Currently CUPED and Sequential Testing are not implemented for Quantile Testing. Multiple Testing Corrections is implemented for Quantile Testing.
7. What is cluster adjustment? Data are clustered when randomization happens at a coarser granularity than the metrics of interest. For example, suppose we are trying to reduce webpage latency. We randomize customers (perhaps due to engineering constraints or testing purposes). A customer may have multiple sessions, i.e., a session is clustered within customer. Latencies for two sessions from the same customer are likelier to be more similar than latencies for two sessions from different customers. Cluster adjustment ensures that we do not overstate the amount of information in the experiment, i.e., uncertainty estimates are valid.
8. Are quantile estimates available via [incremental refresh](/app/data-pipeline#incremental-refresh-recommended-in-beta)? Yes - event-level quantile metrics are supported for BigQuery, which uses KLL sketches to store approximate event-level data for each experiment unit. This provides approximate inference, as small effects may be undetectable.
 ## GrowthBook implementation