> ## Documentation Index
> Fetch the complete documentation index at: https://docs2.growthbook.io/llms.txt
> Use this file to discover all available pages before exploring further.
# Cluster Experiments
> Run cluster experiments in GrowthBook: randomize at a group level such as organization or school, then analyze outcomes at the user level.
Cluster experiments are crucial when you need to **randomize at a group level** but **analyze at an individual level**. For example:
* A B2B software company might want to randomize at the business level so that everyone
at the company gets the same experience, but analyze individual user behavior to measure impact.
* An education technology company might randomize at the school district level due to geographic
constraints, but analyze outcomes at the student level.
In these cases, a cluster of units nests another set of units.
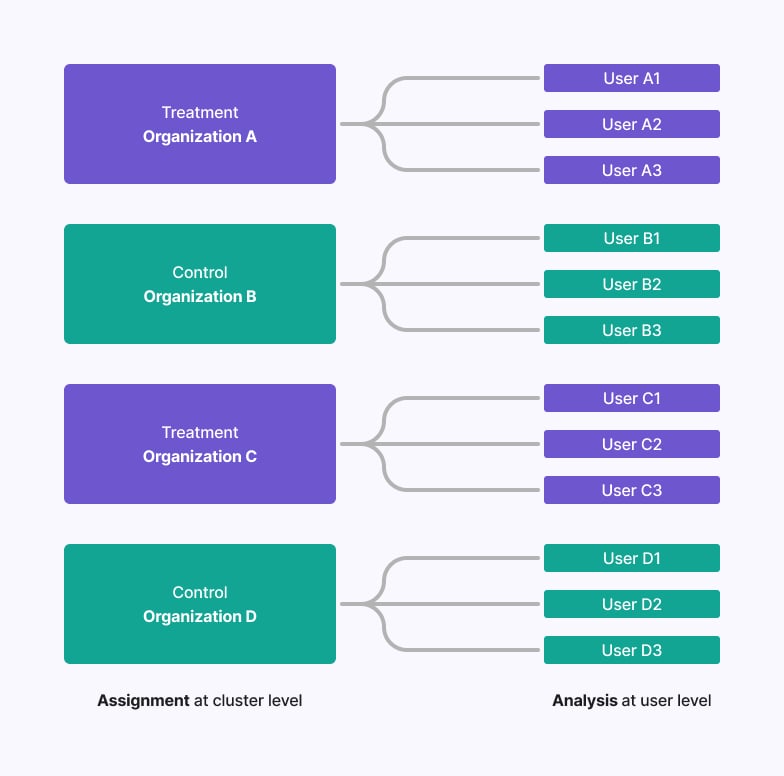 To provide a concrete example, we will use Organizations that nest Users where your goal is to randomize at the Organization level but
analyze User level behavior.
## How to run a Cluster Experiment
Running a cluster experiment at the organization level while analyzing at the user level is possible in GrowthBook using Fact Tables and the robust statistics engine. Here’s how:
### 0. Prerequisites
Before setting up your cluster experiment, ensure you have the following:
* `organization_id` must be set up as an Identifier Type on your **Data Source** page.
* If GrowthBook is handling randomization, create an Attribute `organization_id`.
### 1. Set up a Fact Table with both identifier types
You need a version of your user-level metrics that has the distinct count of users as a custom denominator.
To do this, create a [Fact Table](/app/metrics#fact-tables) that has both `organization_id` and `user_id` as columns,
along with whatever other columns you need to create your metrics of interest. You can also use multiple fact tables with this
configuration if you prefer.
**Avoid multiple organizations per user**
There must be a one-to-many relationship between `organization_id` and `user_id`. Avoid users belonging to multiple organizations, as this can introduce bias.
To provide a concrete example, we will use Organizations that nest Users where your goal is to randomize at the Organization level but
analyze User level behavior.
## How to run a Cluster Experiment
Running a cluster experiment at the organization level while analyzing at the user level is possible in GrowthBook using Fact Tables and the robust statistics engine. Here’s how:
### 0. Prerequisites
Before setting up your cluster experiment, ensure you have the following:
* `organization_id` must be set up as an Identifier Type on your **Data Source** page.
* If GrowthBook is handling randomization, create an Attribute `organization_id`.
### 1. Set up a Fact Table with both identifier types
You need a version of your user-level metrics that has the distinct count of users as a custom denominator.
To do this, create a [Fact Table](/app/metrics#fact-tables) that has both `organization_id` and `user_id` as columns,
along with whatever other columns you need to create your metrics of interest. You can also use multiple fact tables with this
configuration if you prefer.
**Avoid multiple organizations per user**
There must be a one-to-many relationship between `organization_id` and `user_id`. Avoid users belonging to multiple organizations, as this can introduce bias.
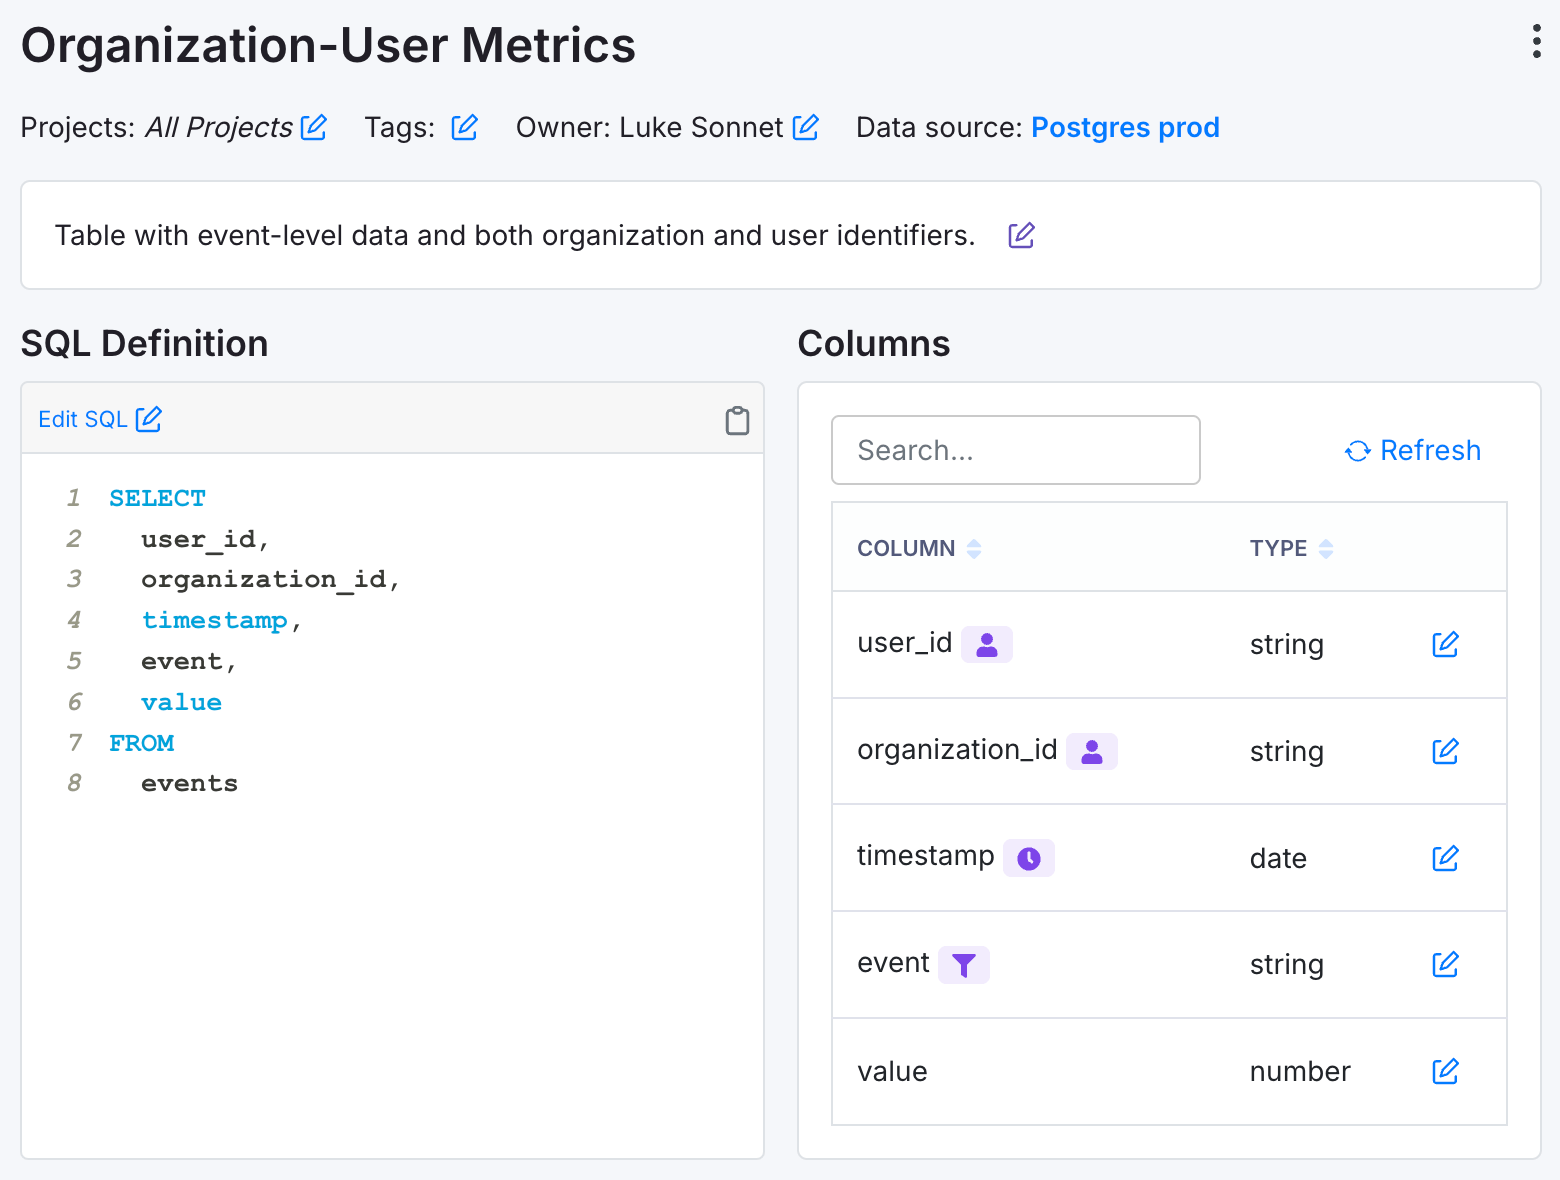 The screenshot above shows:
* `user_id` and `organization_id` identifiers.
* An `event` column that represents the event you are interested in measuring.
* A numeric `value` column that represents the value of the event.
**Ensure every user has at least one event**
Every `user_id` exposed to the experiment should have at least 1 event logged to ensure inclusion in the metric denominator.
### 2. Set up your Metrics
Using this Fact Table, create **Ratio Metrics** that all have the `COUNT DISTINCT` of `user_id` as their denominators.
In the following example, we have a User Revenue metric:
* The numerator is sum the value of all purchases across all users.
* The denominator is the `COUNT DISTINCT` number of `user_id`.
Note that we are not filtering the denominator to just users who made a purchase—instead, our denominator includes all users that had any event in this period.
The screenshot above shows:
* `user_id` and `organization_id` identifiers.
* An `event` column that represents the event you are interested in measuring.
* A numeric `value` column that represents the value of the event.
**Ensure every user has at least one event**
Every `user_id` exposed to the experiment should have at least 1 event logged to ensure inclusion in the metric denominator.
### 2. Set up your Metrics
Using this Fact Table, create **Ratio Metrics** that all have the `COUNT DISTINCT` of `user_id` as their denominators.
In the following example, we have a User Revenue metric:
* The numerator is sum the value of all purchases across all users.
* The denominator is the `COUNT DISTINCT` number of `user_id`.
Note that we are not filtering the denominator to just users who made a purchase—instead, our denominator includes all users that had any event in this period.
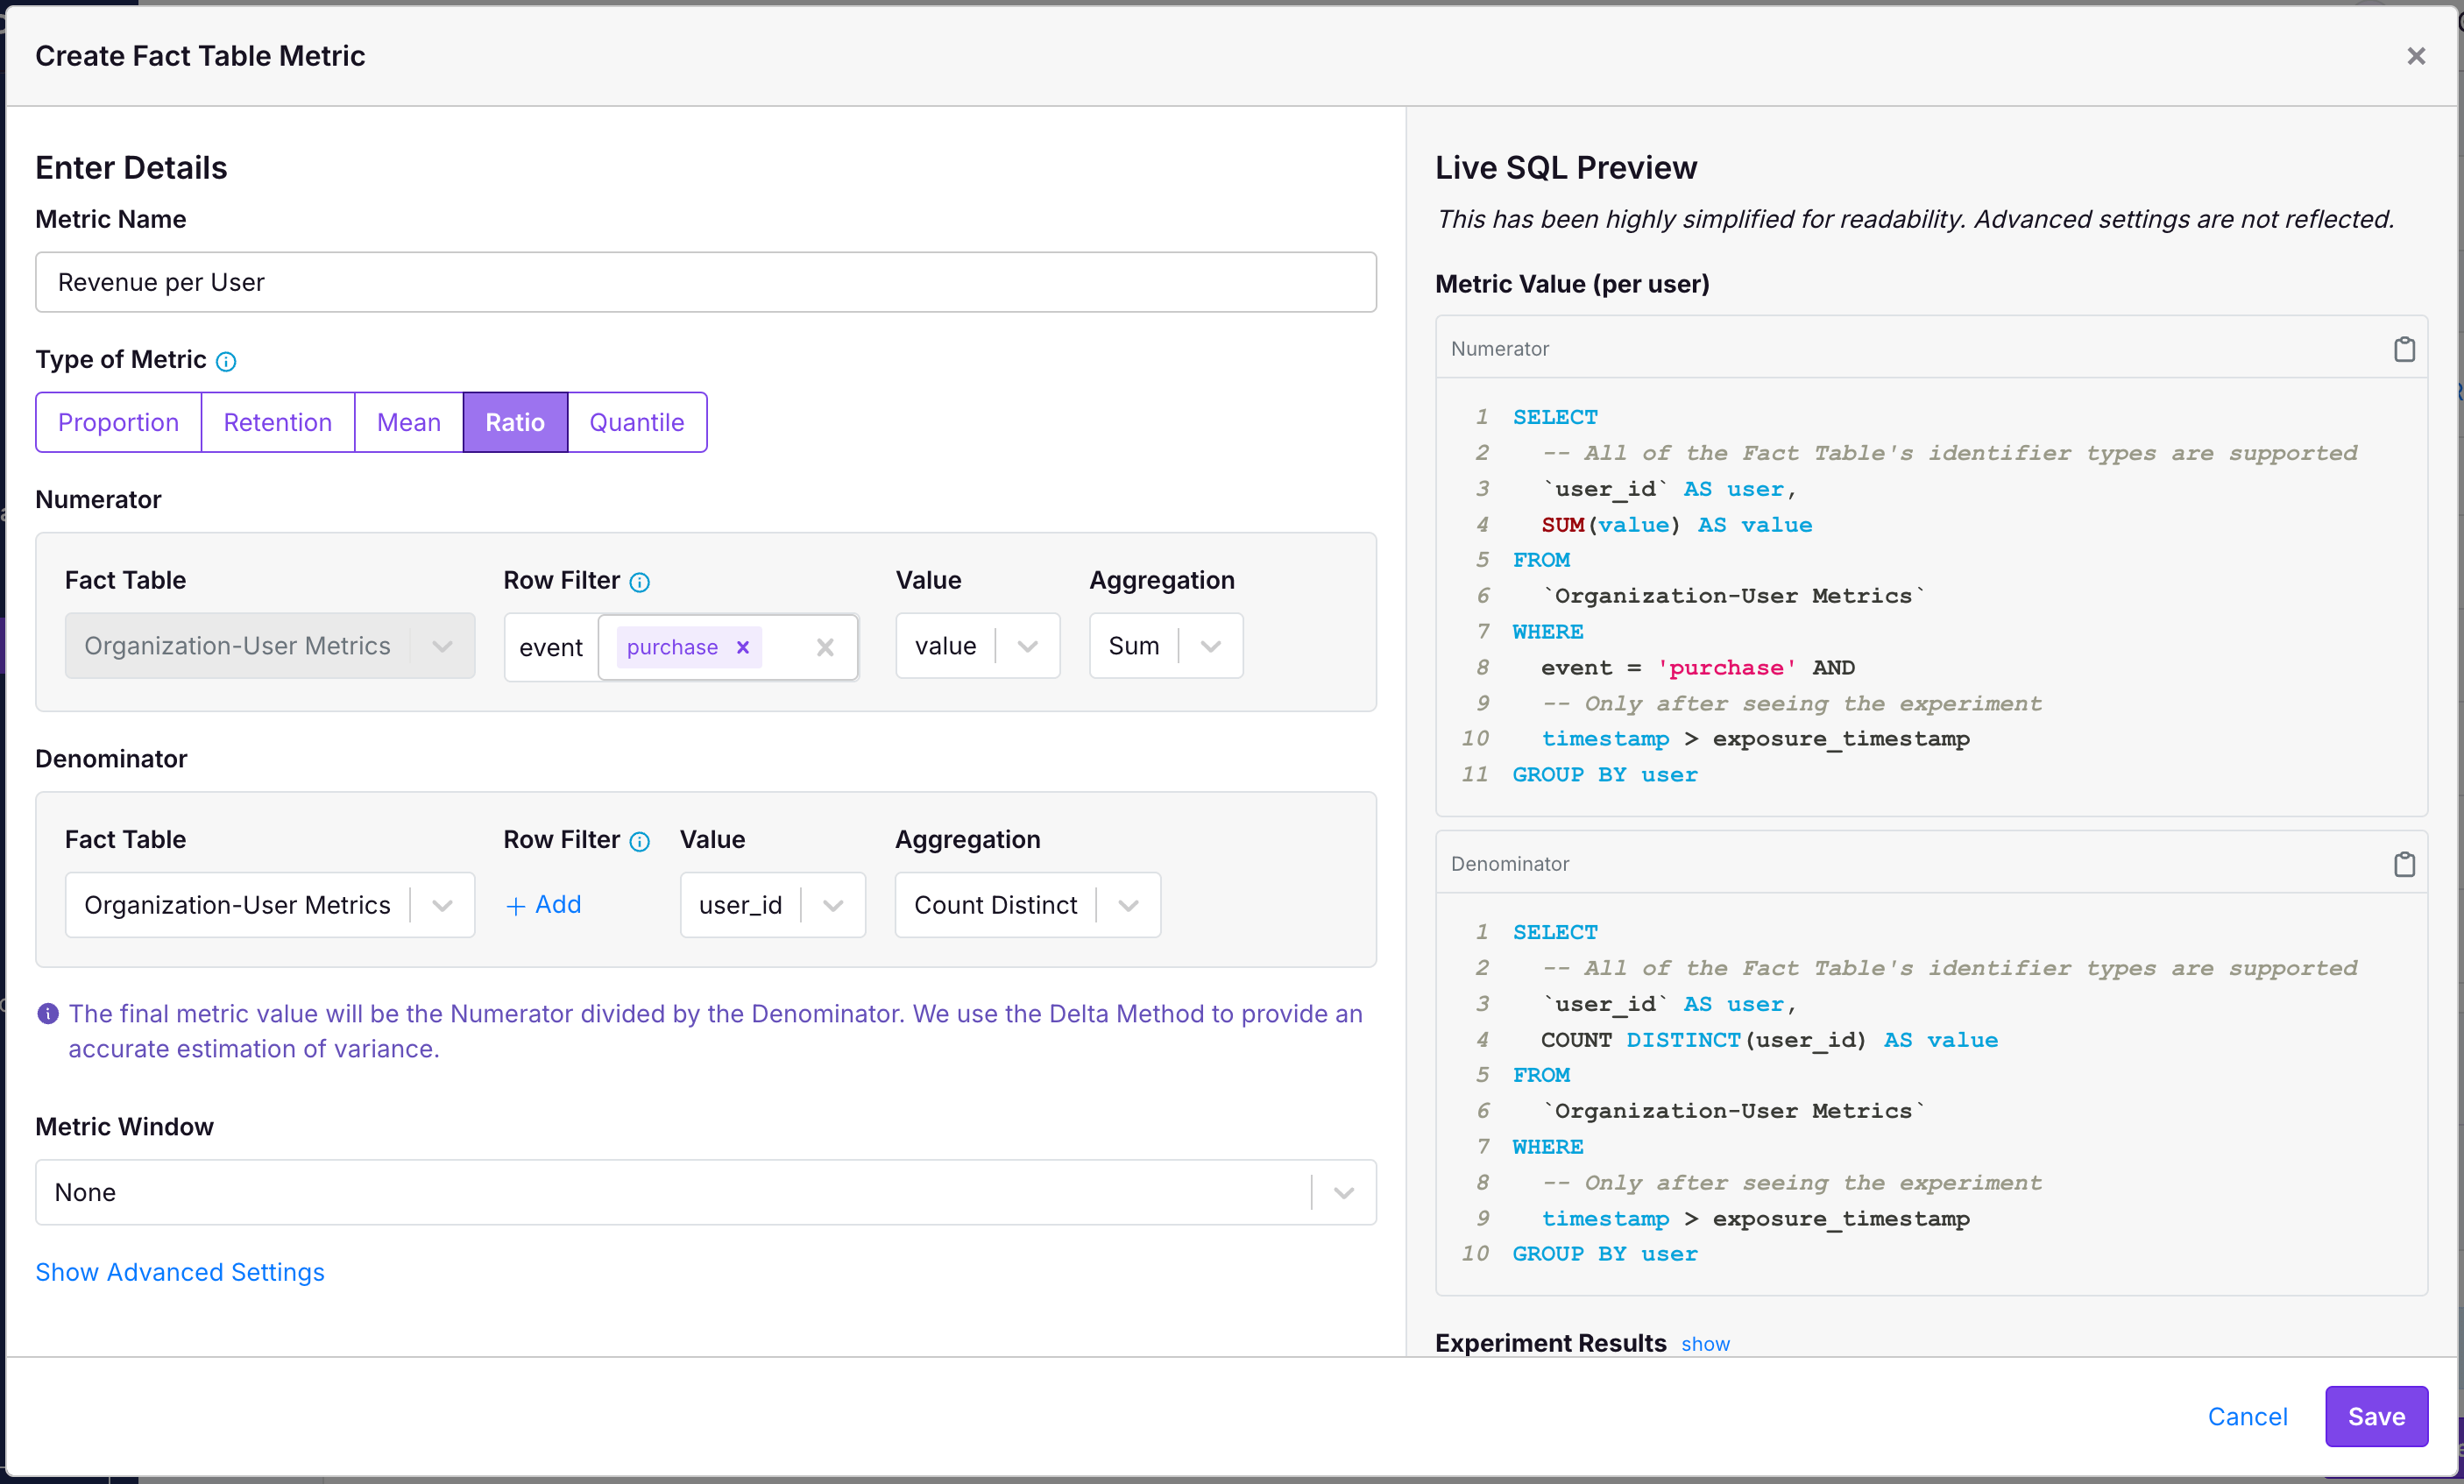 You can also create proportion-style ratio metrics:
* The numerator is a `COUNT DISTINCT` number of `user_id` that did some particular event.
* The denominator is a `COUNT DISTINCT` of `user_id` that logged any event.
These metrics are aggregated by each variation, and our statistics engine uses the [Delta Method](/statistics/details#ratio-metrics) to appropriately account for the fact that you are randomizing at a different level than you are analyzing.
### 3. Create your Experiment at the Organization level
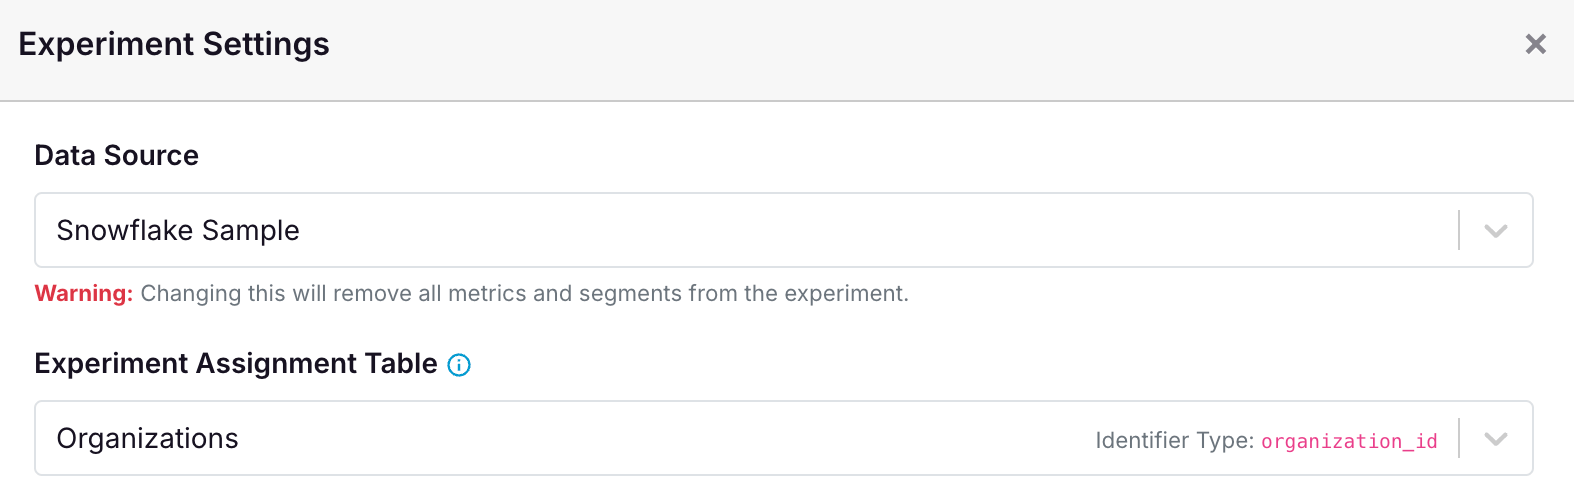
All that is left to do is create your experiment where you randomize at the `organization_id` level. The following screenshot shows an example of that.
You can also create proportion-style ratio metrics:
* The numerator is a `COUNT DISTINCT` number of `user_id` that did some particular event.
* The denominator is a `COUNT DISTINCT` of `user_id` that logged any event.
These metrics are aggregated by each variation, and our statistics engine uses the [Delta Method](/statistics/details#ratio-metrics) to appropriately account for the fact that you are randomizing at a different level than you are analyzing.
### 3. Create your Experiment at the Organization level
All that is left to do is create your experiment where you randomize at the `organization_id` level. The following screenshot shows an example of that.
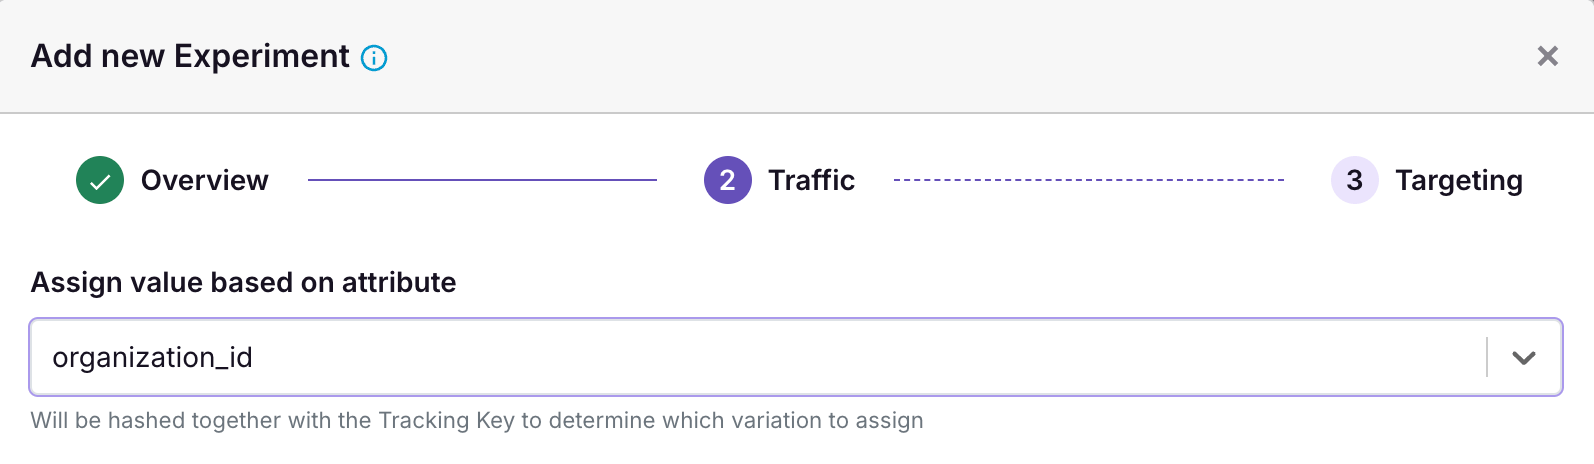 Be sure you pick the Experiment Assignment Table that has your `organization_id` mapping. If you do not have one, you may need to set it up in your Data Source to ensure that GrowthBook knows the mapping between `organization_id` and experiment and variation assignments.
 Add the metrics you created and analyze as usual!