> ## Documentation Index
> Fetch the complete documentation index at: https://docs2.growthbook.io/llms.txt
> Use this file to discover all available pages before exploring further.

# Metric Examples and Use Cases

> Examples of different metrics you can define within GrowthBook

export const HostSelector = () => {
  let currentHost = "cloud";
  let currentCustomDomain = "";
  const HOST_KEY = "gbHost";
  const CUSTOM_DOMAIN_KEY = "gbCustomDomain";
  const initializeHost = () => {
    try {
      const host = localStorage.getItem(HOST_KEY);
      if (host) currentHost = host;
    } catch (e) {}
    try {
      const domain = localStorage.getItem(CUSTOM_DOMAIN_KEY);
      if (domain) currentCustomDomain = domain;
    } catch (e) {}
  };
  const fireDomEvent = () => window.dispatchEvent(new CustomEvent("gbHostChange"));
  initializeHost();
  const [host, setRawHost] = useState(currentHost);
  const setHost = host => {
    try {
      localStorage.setItem(HOST_KEY, host);
    } catch (e) {}
    currentHost = host;
    setRawHost(host);
    fireDomEvent();
  };
  const [customDomain, setRawCustomDomain] = useState(currentCustomDomain);
  const setCustomDomain = domain => {
    try {
      localStorage.setItem(CUSTOM_DOMAIN_KEY, domain);
    } catch (e) {}
    currentCustomDomain = domain;
    setRawCustomDomain(domain);
    fireDomEvent();
  };
  return <div className="flex items-center gap-2">
      <label className="flex items-center gap-2 text-sm font-medium text-gray-700 dark:text-gray-300">
        GrowthBook Host:
        <div className="relative">
          <select value={host} onChange={e => setHost(e.target.value)} className="appearance-none bg-white dark:bg-[#1e2124] text-gray-900 dark:text-gray-100 border border-gray-300 dark:border-gray-600 rounded px-3 py-1.5 pr-8 text-sm cursor-pointer focus:outline-none focus:ring-2 focus:ring-blue-500 dark:focus:ring-blue-400">
            <option value="cloud">Cloud</option>
            <option value="localhost">Localhost</option>
            <option value="custom">Custom Domain</option>
          </select>
          <div className="pointer-events-none absolute inset-y-0 right-0 flex items-center px-2 text-gray-500 dark:text-gray-400">
            <svg className="w-4 h-4" fill="none" stroke="currentColor" viewBox="0 0 24 24">
              <path strokeLinecap="round" strokeLinejoin="round" strokeWidth={2} d="M19 9l-7 7-7-7" />
            </svg>
          </div>
        </div>
      </label>
      {host === "custom" && <input value={customDomain} type="url" onChange={e => setCustomDomain(e.target.value)} placeholder="https://..." className="bg-white dark:bg-[#1e2124] text-gray-900 dark:text-gray-100 border border-gray-300 dark:border-gray-600 rounded px-3 py-1.5 text-sm focus:outline-none focus:ring-2 focus:ring-blue-500 dark:focus:ring-blue-400" />}
    </div>;
};

export const AddMetricButton = ({data}) => {
  let currentHost = "cloud";
  let currentCustomDomain = "";
  const HOST_KEY = "gbHost";
  const CUSTOM_DOMAIN_KEY = "gbCustomDomain";
  const ExternalLink = () => {
    return <svg width="13.5" height="13.5" aria-hidden="true" viewBox="0 0 24 24">
        <path fill="currentColor" d="M21 13v10h-21v-19h12v2h-10v15h17v-8h2zm3-12h-10.988l4.035 4-6.977 7.07 2.828 2.828 6.977-7.07 4.125 4.172v-11z"></path>
      </svg>;
  };
  const useGrowthBookHost = () => {
    const initializeHost = () => {
      try {
        const host = localStorage.getItem(HOST_KEY);
        if (host) currentHost = host;
      } catch (e) {}
      try {
        const domain = localStorage.getItem(CUSTOM_DOMAIN_KEY);
        if (domain) currentCustomDomain = domain;
      } catch (e) {}
    };
    const getGrowthBookHost = () => {
      initializeHost();
      if (currentHost === "custom" && currentCustomDomain) {
        let domain = currentCustomDomain.replace(/\/$/, "");
        if (!domain.startsWith("http")) domain = "https://" + domain;
        return domain;
      }
      if (currentHost === "localhost") return "http://localhost:3000";
      return "https://app.growthbook.io";
    };
    const [host, updateHost] = useState(getGrowthBookHost());
    useEffect(() => {
      const listener = () => updateHost(getGrowthBookHost());
      window.addEventListener("gbHostChange", listener);
      return () => window.removeEventListener("gbHostChange", listener);
    }, []);
    return host;
  };
  const host = useGrowthBookHost();
  const url = `${host}/metrics?addMetric=${encodeURIComponent(JSON.stringify(data))}`;
  return <a href={url} target="_blank" rel="noopener noreferrer" className="group inline-flex items-center justify-center shrink-0 select-none align-top not-italic text-center rounded-md bg-[#6e56cf] !text-white text-base leading-6 py-2 px-4 font-medium border-0 hover:border-b-0">
      <span className="mr-1.5 group-hover:underline">Add to GrowthBook</span>{" "}
      <ExternalLink />
    </a>;
};

Fact Tables in GrowthBook are a powerful way to quickly build out a library of metrics.

Below are some common types of tables in your data warehouse and how to map them to Fact Tables with example SQL and metric definitions.

The **Add to GrowthBook** buttons will open GrowthBook and let you customize the metric before adding it to your account.

<HostSelector />

## Raw Events Table

The most common form of analytics data is a raw event stream. Every time a user does something, you append a new row to an events table in your warehouse. All types of events from all users are intermixed in this one table.

Fact Tables in GrowthBook work really well with raw events. When defining your Fact Table in GrowthBook, there are 4 important types of columns you will want to select:

1. Timestamp - When the event occurred
2. Ids - Who triggered the event (user id, device id, etc.)
3. Event Type - What action was performed (page view, start checkout, add friend, etc.)
4. Context - Any helpful user or app context (geo-location, current url, account plan, etc.)

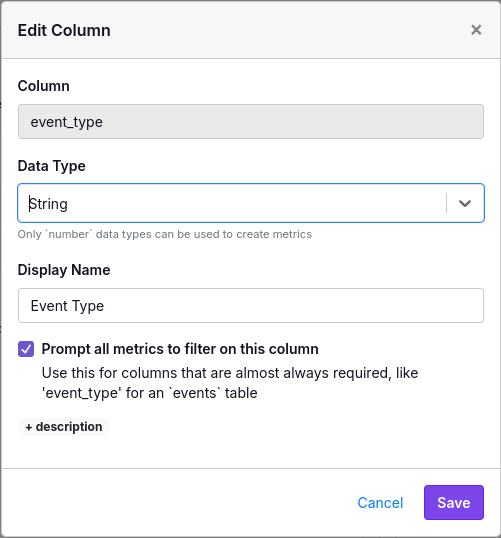
When creating metrics, you will almost always want to filter on the Event Type. To make this easier, you can edit the column representing Event Type and check the “Prompt all metrics” box (after creating your Fact Table). This helps GrowthBook better streamline the UI when creating metrics.

<Frame>
  <img src="https://mintcdn.com/growthbook-ea15456d/hKkmiLOwhH6E2xcD/static/images/metrics/inline-filter.png?fit=max&auto=format&n=hKkmiLOwhH6E2xcD&q=85&s=88cda3b588595dc8b04eb560b3ccaa9d" alt="Event Type Filter" width="501" height="538" data-path="static/images/metrics/inline-filter.png" />
</Frame>

### Example SQL: Google Analytics 4 (GA4) Events

When you configure Google Analytics 4 to sync events into BigQuery, they get written to a raw events table (actually multiple tables partitioned by day, but that’s more of an implementation detail)

Here’s example SQL for a fact table. Comments added to highlight the 5 column types above

```sql theme={null}
SELECT
  -- Timestamp
  TIMESTAMP_MICROS(event_timestamp) as timestamp,
  -- Ids
  user_id,
  user_pseudo_id as anonymous_id,
  -- Event type
  event_name,
  -- Context
  event_value, -- e.g. the page view path
  geo.country,
  device.category as device_category
FROM
  `events_*`
```

For faster and cheaper queries, we can take advantage of the date partitioning table scheme. GrowthBook lets you use date template variables that are evaluated right before executing the SQL. By doing this, we can restrict our query to just the relevant dates for the experiment we are analyzing.

Change the end of the query and add the following WHERE clause:

```sql theme={null}
FROM
  `events_*`
WHERE
  -- Daily tables
  ((_TABLE_SUFFIX BETWEEN '{{date startDateISO "yyyyMMdd"}}' AND '{{date endDateISO "yyyyMMdd"}}')
  -- Realtime streaming intraday table
  OR (_TABLE_SUFFIX BETWEEN 'intraday_{{date startDateISO "yyyyMMdd"}}' AND 'intraday_{{date endDateISO "yyyyMMdd"}}'))
```

### Example Metrics

#### Percent of users who submit a form

1. Select `Proportion` as the metric type
2. Choose `form_submit` as the event type

<AddMetricButton
  data={{
name: "Form Submissions",
description: "Percent of users who submit a form",
metricType:"proportion",
numerator: {
rowFilters: [
  {
    column: "event_name",
    operator: "=",
    values: ["form_submit"]
  }
]
}
}}
/>

#### Percent of users who visit the checkout page

1. Select `Proportion` as the metric type
2. Choose `page_view` as the event type
3. Add a “Row Filter” and select `page_path = '/checkout'`

<AddMetricButton
  data={{
name: "Checkout Page Views",
description: "Percent of users who visit the checkout page",
metricType:"proportion",
numerator: {
rowFilters: [
  {
    column: "event_name",
    operator: "=",
    values: ["page_view"]
  },
  {
    column: "page_path",
    operator: "=",
    values: ["/checkout"]
  }
]
}
}}
/>

#### Page Views per User

1. Select `Mean` as the metric type
2. Choose `page_view` as the event type
3. Select `Count of Rows` as the value

<AddMetricButton
  data={{
name: "Page Views per User",
description: "Average number of page views per user",
metricType:"mean",
numerator: {
column:"$$count",
rowFilters: [
  {
    column: "event_name",
    operator: "=",
    values: ["page_view"]
  }
]
}
}}
/>

#### Unique Page Views per User

1. Select `Mean` as the metric type
2. Choose `page_view` as the event type
3. Select `event_value` as the column
4. Select `COUNT DISTINCT` as the aggregation

<AddMetricButton
  data={{
name: "Unique Page Views per User",
description: "Average number of unique pages viewed by user",
metricType: "mean",
numerator: {
column: "event_value",
rowFilters: [
  {
    column: "event_name",
    operator: "=",
    values: ["page_view"]
  }
],
aggregation: "count distinct"
}
}}
/>

#### Active Days per User

1. Select `Mean` as the metric type
2. Choose `Distinct Dates` as the column

<AddMetricButton
  data={{
name: "Active Days per User",
description: "Average number of active days per user",
metricType: "mean",
numerator: {
column: "$$distinctDates"
}
}}
/>

#### Checkout completion rate

1. Select `Ratio` as the metric type
2. For the **numerator** (confirmation)
   1. Choose `page_view` as the event type
   2. Add a Row Filter for `page_path = '/confirmation'`
   3. Select `Unique Users` as the value
3. For the **denominator** (checkout)
   1. Choose `page_view` as the event\_type
   2. Add a Row Filter for `page_path = '/checkout'`
   3. Select `Unique Users` as the value

<AddMetricButton
  data={{
name: "Checkout Completion Rate",
description: "Of users who start checkout, what percent complete it",
metricType:"ratio",
numerator: {
column: "$$distinctUsers",
rowFilters: [
  {
    column: "event_name",
    operator: "=",
    values: ["page_view"]
  },
  {
    column: "page_path",
    operator: "=",
    values: ["/confirmation"]
  }
]
},
denominator: {
column: "$$distinctUsers",
rowFilters: [
  {
    column: "event_name",
    operator: "=",
    values: ["page_view"]
  },
  {
    column: "page_path",
    operator: "=",
    values: ["/checkout"]
  }
]
}
}}
/>

## Modeled Tables

Another common way to store data in a warehouse is with modelling. This usually involves a tool like `dbt` that transforms raw event logs into multiple well-structured tables. There are also some event tracking tools like Segment which do this automatically.

For our purposes, we are only considering modeled tables that do not include a GROUP BY in the data pipeline - in other words, the rows are still at the raw event-level. Check out the Pre-aggregated Tables section below if this is not the case.

In GrowthBook, we recommend creating a separate Fact Table for each one of your modeled tables. At the very least, you will need a Timestamp and IDs of who performed the action. Any additional columns you add are optional and can be used to build out metrics.

### Example SQL: E-Commerce Orders Table

```sql theme={null}
SELECT
  -- Timestamp
  received_at as timestamp,
  -- IDs
  user_id,
  -- Other custom columns
  num_items,
  grand_total,
  shipping_type
FROM orders
```

Because this is a modeled table just for orders, we can select event-specific columns like `num_items`, `grand_total`, and `shipping_type`. These columns will help us build out a rich set of metrics. This is one of the big benefits over using a raw events table directly where the columns you select need to be more generic and work across a wide range of different events.

Similar to raw event tables, you can optionally add a WHERE clause on dates for faster/cheaper queries:

```sql theme={null}
FROM orders
WHERE
  timestamp BETWEEN '{{startDate}}' AND '{{endDate}}'
```

### Example Metrics

#### Users who Purchased

1. Select `Proportion` as the metric type and that’s it!

<AddMetricButton
  data={{
name: "Users who Purchased",
description: "Percent of users who made a purchase",
metricType:"proportion",
numerator: {}
}}
/>

#### Users who Purchased Multiple Times

1. Select `Proportion` as the metric type
2. Add a “User Filter” based on `Count of Rows`
3. Enter `>= 2` as the User Filter value

<AddMetricButton
  data={{
name: "Users who Purchased Multiple Times",
description: "Percent of users who made more than one purchase",
metricType:"proportion",
numerator: {
aggregateFilterColumn: "$$count",
aggregateFilter: ">= 2"
}
}}
/>

#### Orders per User

1. Select `Mean` as the metric type
2. Select `Count of Rows` as the metric value

<AddMetricButton
  data={{
name: "Orders per User",
description: "Average number of orders per user",
metricType:"mean",
numerator: {
column:"$$count"
}
}}
/>

#### Revenue per User

1. Select `Mean` as the metric type
2. Select `SUM(grand_total)` as the metric value

<AddMetricButton
  data={{
name: "Revenue per User",
description: "Average revenue per user",
metricType:"mean",
numerator: {
column:"grand_total"
}
}}
/>

#### Average Items per Order

1. Select `Ratio` as the metric type
2. For the numerator, select `SUM(num_items)`
3. For the denominator, select `Count of Rows`

<AddMetricButton
  data={{
name: "Average Items per Order",
description: "Average number of items per order",
metricType:"ratio",
numerator: {
column:"num_items"
},
denominator: {
column:"$$count"
}
}}
/>

#### Users Without Orders

1. Select `Proportion` as the metric type
2. Add a “User Filter” for `Count of Rows = 0`
3. Under Advanced Settings -> Display Settings, change the goal to `Decrease the Metric Value`

<AddMetricButton
  data={{
name: "Users Without Orders",
description: "Percent of users who have not made a purchase",
metricType:"proportion",
numerator: {
aggregateFilterColumn: "$$count",
aggregateFilter: "= 0"
},
inverse: true
}}
/>

#### Percent of Orders with Free Shipping

1. Select `Ratio` as the metric type
2. For the numerator, add a row filter for `shipping_type = 'free'`
3. Select `Count of Rows` for both the numerator and denominator

<AddMetricButton
  data={{
name: "Percent of Orders with Free Shipping",
description: "Percent of orders that have free shipping",
metricType:"ratio",
numerator: {
rowFilters: [
  {
    column: "shipping_type",
    operator: "=",
    values: ["free"]
  }
],
column:"$$count"
},
denominator: {
column:"$$count"
}
}}
/>

## Pre-Aggregated Tables

Pre-aggregated tables include a GROUP BY in the data pipeline to compress raw event-level data down to fewer rows. This is usually done when querying raw data directly is prohibitively expensive.

GrowthBook supports pre-aggregated tables as long as they satisfy two requirements:

* Must be grouped by both user and date
* Pre-aggregated columns can only be basic sums or counts. No averages, percentiles, count distinct, or complex derived formulas that break statistical assumptions.

Using pre-aggregated tables for experimentation comes with additional complexities and downsides, so we highly recommend sticking with event-level data whenever possible.

### Example SQL: Social Media Interactions (User/Date Rollup)

If you have a social media app, the number of raw interactions might be huge. A user/date rollup table can drastically reduce the size of the data set. Here is an example Fact Table SQL definition in GrowthBook that references a user/date rollup table.

```sql theme={null}
SELECT
  date as timestamp,
  user_id,
  -- Aggregated columns (sums/counts only)
  interactions,
  likes,
  comments
FROM user_date_rollup
```

Pre-aggregated tables have a problem. The `timestamp` column isn’t very accurate. All events for a day are recorded as happening at the beginning of the day (usually at midnight). We only consider Fact Table rows with a timestamp after a user first enters an experiment. That basically means a user’s first day of data will be excluded from the analysis. This is a big deal because those first few hours after entering a test are often the most important.

We can fix this by incrementing all timestamps by 1 day in our Fact Table definition (specific SQL varies by db engine):

```sql theme={null}
SELECT
  DATE_ADD(date, INTERVAL '1 day') as timestamp,
  user_id
  ...
```

This introduces a new problem however - we will now potentially include actions from before a user saw an experiment, which can introduce noise to the results. In our experience, this is usually the lesser of two evils and thus, this is the approach we recommend.

Of course, you can solve both of these problems by not pre-aggregating in the first place, but we understand sometimes that’s just not an option.

### Example Metrics

#### Percent of Users with High Engagement

1. Select `Proportion` as the metric type
2. Add a “User Filter” and select `SUM(interactions)` as the value to filter on
3. Add some threshold as the User Filter value. Something like `> 100`

<AddMetricButton
  data={{
name: "High Engagement Users",
description: "Percent of users with more than 100 interactions",
metricType:"proportion",
numerator: {
aggregateFilterColumn: "interactions",
aggregateFilter: "> 100"
}
}}
/>

#### Interactions per User

1. Select `Mean` as the metric type
2. Select `SUM(interactions)` as the value

<AddMetricButton
  data={{
name: "Interactions per User",
description: "Average number of interactions per user",
metricType:"mean",
numerator: {
column:"interactions"
}
}}
/>

#### P90 Likes per User

1. Select `Quantile` as the metric type
2. Check the "Group by user" box
3. Select `SUM(likes)` as the per-user value
4. Select `P90` as the quantile level

<AddMetricButton
  data={{
name: "P90 Likes per User",
description: "90th percentile of likes per user",
metricType:"quantile",
numerator: {
column:"likes"
},
quantileSettings: {
quantile: 0.9,
type: "unit",
ignoreZeros: false
}
}}
/>

#### Comment-to-Like Ratio

1. Select `Ratio` as the metric type
2. Select `SUM(comments)` as the numerator value
3. Select `SUM(likes)` as the denominator value

<AddMetricButton
  data={{
name: "Comment-to-Like Ratio",
description: "Ratio of comments to likes",
metricType:"ratio",
numerator: {
column:"comments"
},
denominator: {
column:"likes"
}
}}
/>
