> ## Documentation Index
> Fetch the complete documentation index at: https://docs2.growthbook.io/llms.txt
> Use this file to discover all available pages before exploring further.
# Dimensions
> Drill down into experiment results
Dimensions let you drill down into experiment results. For example, if you define a `browser` dimension, you can
see how Safari users behaved vs Chrome.
Be careful, the more dimensions and metrics you look at for an experiment, the more likely you are to see false positives -
something that looks significant when it really isn't. For example, if you break out results by country, it's pretty likely that at least one of the 100+
countries in your dataset will be significantly different just by random chance.
It's best to treat dimensions as an exploratory tool and not something to directly draw conclusions from.
The two best use cases are identfying bugs (the `browser` example) and getting ideas for dedicated follow-up experiments.
Dimensions are supported for both Mixpanel and SQL data sources.
## Breaking down by more than one dimension
GrowthBook currently only supports selecting a single dimension at a time when viewing experiment
results. There isn't native support yet for combining two or more dimensions into one breakdown, but
there are two workarounds:
* **Custom SQL filter**: If one of your dimensions already exists on your experiment assignment query,
add a custom SQL filter in the experiment's analysis settings to restrict results to a specific value
of that dimension, then use the dimension selector to break down by the second dimension.
* **Custom dimension SQL**: Create a new dimension whose SQL computes the intersection of the two
dimensions you care about — for example, concatenating `country` and `account_type` into a single
value like `US - premium`. See the [User Dimensions](#user-dimensions) section below for how to write
custom dimension SQL.
## SQL
There are two types of dimensions for SQL data sources: Experiment Dimensions and User Dimensions. Experiment dimensions are more reliable for producing unbiased experiment analyses because we can always know the dimension that is associated with the first experiment exposure for a unit. Using dimension data that could be affected by the experiment (e.g. that is collected *after* the first experiment exposure) could bias dimension drill-downs. Therefore, use user dimensions with caution, and we suggest using immutable dimensions as your user dimensions (e.g. the first client the user ever used, or the first country the user ever logged in from).
For all experiment analyses, we only ever choose one dimension per user, to avoid the aforementioned issues with potential bias. For Experiment Dimensions, we select the dimension associated with the user's first exposure event for the experiment. For User Dimensions, we strongly suggest only having one dimension value per user, as we cannot discern what dimension a user had before the experiment. Instead, we simply choose the `MAX(value)` for the user dimension.
### Experiment Dimensions
These are attributes that are specific to the point-in-time that a user was put into an experiment. For example, `browser` or `referrer`.
Instead of a standalone SQL query, experiment dimensions are simply extra columns you return from the Experiment assignment query defined for your data source.
As an example, if you set the following as your experiment assignment query:
```sql theme={null}
SELECT
user_id,
received_at as timestamp,
experiment_id,
variation_id,
browser
FROM
experiment_viewed
```
The first 4 columns are standard, but `browser` is a custom one that can be used as an Experiment Dimension.
#### Configuring Experiment Dimensions
To power the health tab and pre-computed dimension results, you need to configure your Experiment Dimensions. You can do this by clicking the "Configure Dimensions" button in the kebab menu next to the exposure query where the Experiment Dimensions are defined:
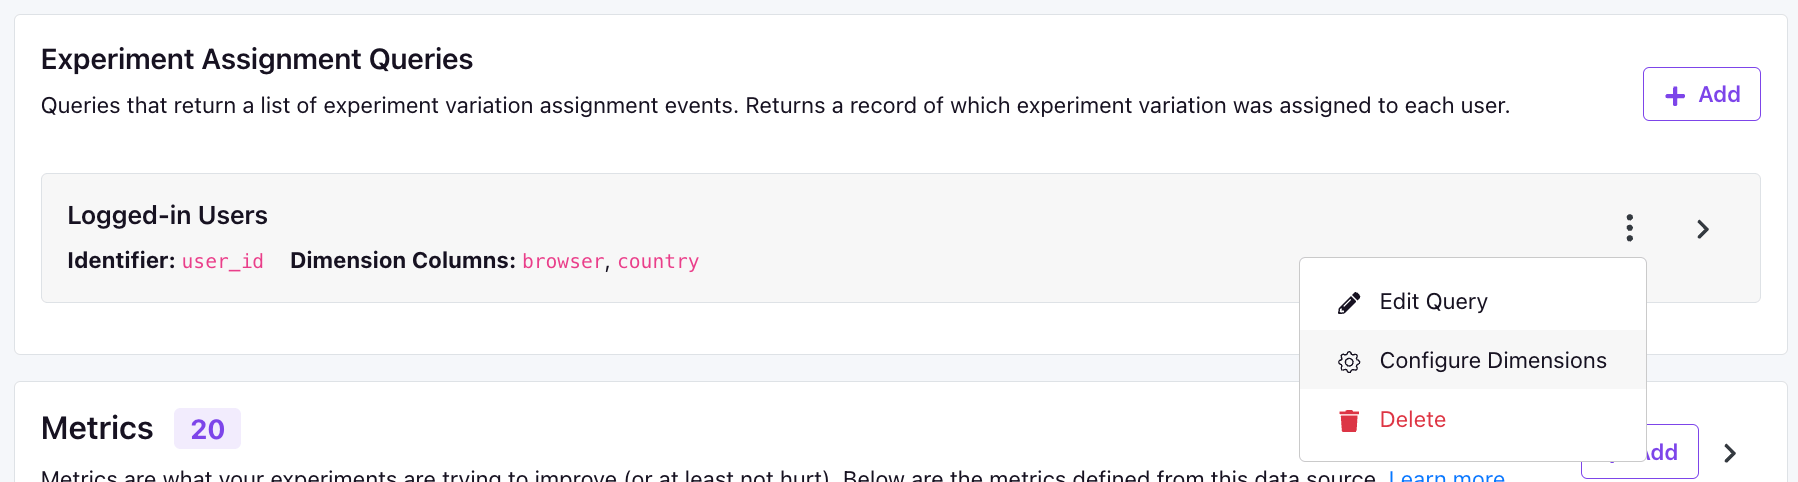 In the modal that pops up, you can run a query to find the top 20 dimension slices for your Experiment Dimensions and save them for use on the health tab.
If you want to have more control over the pre-defined slices, the best way to do so is to modify the Exposure Query SQL to include a `CASE` statement that defines the dimension slices. For example, if you wanted to have a `browser` dimension with slices for `Chrome`, `Safari`, and `Other`, you could do something like this:
```sql theme={null}
SELECT
user_id,
received_at as timestamp,
experiment_id,
variation_id,
CASE
WHEN browser LIKE '%Chrome%' THEN 'Chrome'
WHEN browser LIKE '%Safari%' THEN 'Safari'
ELSE 'Other'
END as browser
FROM
experiment_viewed
```
### User Dimensions
These are attributes of your users that are relatively stable over time, and ideally, do not change over the course of an experiment. For example, `cohort`, `initial age group`, or `first client used`.
A user dimension is defined by a simple SQL query that returns two columns: an identifier and `value`. The name of the identifier column depends on which identifier type the dimension is using. Remember, when using these for analysis, we will pick the `MAX(value)` for each user, and therefore it is best to only have one value per user.
Here's an example SQL using an immutable attribute (the user's first country):
```sql theme={null}
-- Assumes identifier type is "user_id"
SELECT
user_id,
first_country as value
FROM
users
```
It's best to keep the number of unique values for a dimension small if possible to avoid the False Positive issues discussed above. We automatically cap the number at 20, but you can do it yourself if you want more control. Here's an example using the "first\_country" dimension:
```sql theme={null}
SELECT
user_id,
(
CASE WHEN first_country = 'us' THEN 'US'
WHEN first_country = 'uk' THEN 'UK'
ELSE 'Other' END
) as value
FROM
users
```
If you need to use a dimension that can change over time, you should use the `{{ startDate }}` template variable to pin it to the value the user had before the experiment started:
```sql theme={null}
SELECT
user_id,
plan_type as value
FROM
subscriptions
WHERE
timestamp < '{{ startDate }}'
```
**SQL template variables**
You can use `{{ startDate }}`, `{{ endDate }}`, and `{{ experimentId }}` in dimension queries to scope your data to the experiment's time window. See the [SQL Templates](/app/sql-templates) page for more details.
## Mixpanel
For mixpanel, there is just a single type of dimension that is based on event properties (at this time Mixpanel user properties are not supported).
For simple dimensions, you can just put the event property name directly. For example: `$browser`.
We also support complex javascript expressions. For example:
```
event.properties.$browser.match(/chrome/i) ? "Chrome" : "Other"
```
For more complex expressions, you can wrap your code in an anonymous function:
```
(() => {
// ...some complex logic
return dimensionValue
})()
```
You can also reference the experiment start/end date in your javascript expression. For example, if you add a super event called `userRegistrationDate` that stores a unix timestamp, you could make a `New vs Existing` dimension like this:
```
event.properties.userRegistrationDate >= {{ startDateUnix }} ? "new" : "existing"
```
The variables you can reference are:
* **startDate** - `YYYY-MM-DD HH:mm:ss` of the earliest data that needs to be included
* **startYear** - Just the `YYYY` of the startDate
* **startMonth** - Just the `MM` of the startDate
* **startDay** - Just the `DD` of the startDate
* **startDateUnix** - Unix timestamp of the startDate (seconds since Jan 1, 1970)
* **endDate** - `YYYY-MM-DD HH:mm:ss` of the latest data that needs to be included
* **endYear** - Just the `YYYY` of the endDate
* **endMonth** - Just the `MM` of the endDate
* **endDay** - Just the `DD` of the endDate
* **endDateUnix** - Unix timestamp of the endDate (seconds since Jan 1, 1970)
* **experimentId** - Either a specific experiment id OR `%` if you should include all experiments
In the modal that pops up, you can run a query to find the top 20 dimension slices for your Experiment Dimensions and save them for use on the health tab.
If you want to have more control over the pre-defined slices, the best way to do so is to modify the Exposure Query SQL to include a `CASE` statement that defines the dimension slices. For example, if you wanted to have a `browser` dimension with slices for `Chrome`, `Safari`, and `Other`, you could do something like this:
```sql theme={null}
SELECT
user_id,
received_at as timestamp,
experiment_id,
variation_id,
CASE
WHEN browser LIKE '%Chrome%' THEN 'Chrome'
WHEN browser LIKE '%Safari%' THEN 'Safari'
ELSE 'Other'
END as browser
FROM
experiment_viewed
```
### User Dimensions
These are attributes of your users that are relatively stable over time, and ideally, do not change over the course of an experiment. For example, `cohort`, `initial age group`, or `first client used`.
A user dimension is defined by a simple SQL query that returns two columns: an identifier and `value`. The name of the identifier column depends on which identifier type the dimension is using. Remember, when using these for analysis, we will pick the `MAX(value)` for each user, and therefore it is best to only have one value per user.
Here's an example SQL using an immutable attribute (the user's first country):
```sql theme={null}
-- Assumes identifier type is "user_id"
SELECT
user_id,
first_country as value
FROM
users
```
It's best to keep the number of unique values for a dimension small if possible to avoid the False Positive issues discussed above. We automatically cap the number at 20, but you can do it yourself if you want more control. Here's an example using the "first\_country" dimension:
```sql theme={null}
SELECT
user_id,
(
CASE WHEN first_country = 'us' THEN 'US'
WHEN first_country = 'uk' THEN 'UK'
ELSE 'Other' END
) as value
FROM
users
```
If you need to use a dimension that can change over time, you should use the `{{ startDate }}` template variable to pin it to the value the user had before the experiment started:
```sql theme={null}
SELECT
user_id,
plan_type as value
FROM
subscriptions
WHERE
timestamp < '{{ startDate }}'
```
**SQL template variables**
You can use `{{ startDate }}`, `{{ endDate }}`, and `{{ experimentId }}` in dimension queries to scope your data to the experiment's time window. See the [SQL Templates](/app/sql-templates) page for more details.
## Mixpanel
For mixpanel, there is just a single type of dimension that is based on event properties (at this time Mixpanel user properties are not supported).
For simple dimensions, you can just put the event property name directly. For example: `$browser`.
We also support complex javascript expressions. For example:
```
event.properties.$browser.match(/chrome/i) ? "Chrome" : "Other"
```
For more complex expressions, you can wrap your code in an anonymous function:
```
(() => {
// ...some complex logic
return dimensionValue
})()
```
You can also reference the experiment start/end date in your javascript expression. For example, if you add a super event called `userRegistrationDate` that stores a unix timestamp, you could make a `New vs Existing` dimension like this:
```
event.properties.userRegistrationDate >= {{ startDateUnix }} ? "new" : "existing"
```
The variables you can reference are:
* **startDate** - `YYYY-MM-DD HH:mm:ss` of the earliest data that needs to be included
* **startYear** - Just the `YYYY` of the startDate
* **startMonth** - Just the `MM` of the startDate
* **startDay** - Just the `DD` of the startDate
* **startDateUnix** - Unix timestamp of the startDate (seconds since Jan 1, 1970)
* **endDate** - `YYYY-MM-DD HH:mm:ss` of the latest data that needs to be included
* **endYear** - Just the `YYYY` of the endDate
* **endMonth** - Just the `MM` of the endDate
* **endDay** - Just the `DD` of the endDate
* **endDateUnix** - Unix timestamp of the endDate (seconds since Jan 1, 1970)
* **experimentId** - Either a specific experiment id OR `%` if you should include all experiments